Frappe
Products
Learning
Insights & Reporting
Frappe
Products
Insights
features
Insights & Reporting
Running training is easier when you can see how it’s going. Whether you’re reporting onboarding progress to a manager, checking on a compliance deadline or seeing how a community course is doing, the numbers are already in Frappe Learning. Nothing to export to a spreadsheet, nothing to set up.
1.
Your whole academy at a glance
2.
How each course is going
3.
Who’s on track in a batch
4.
Whether videos are actually watched
5.
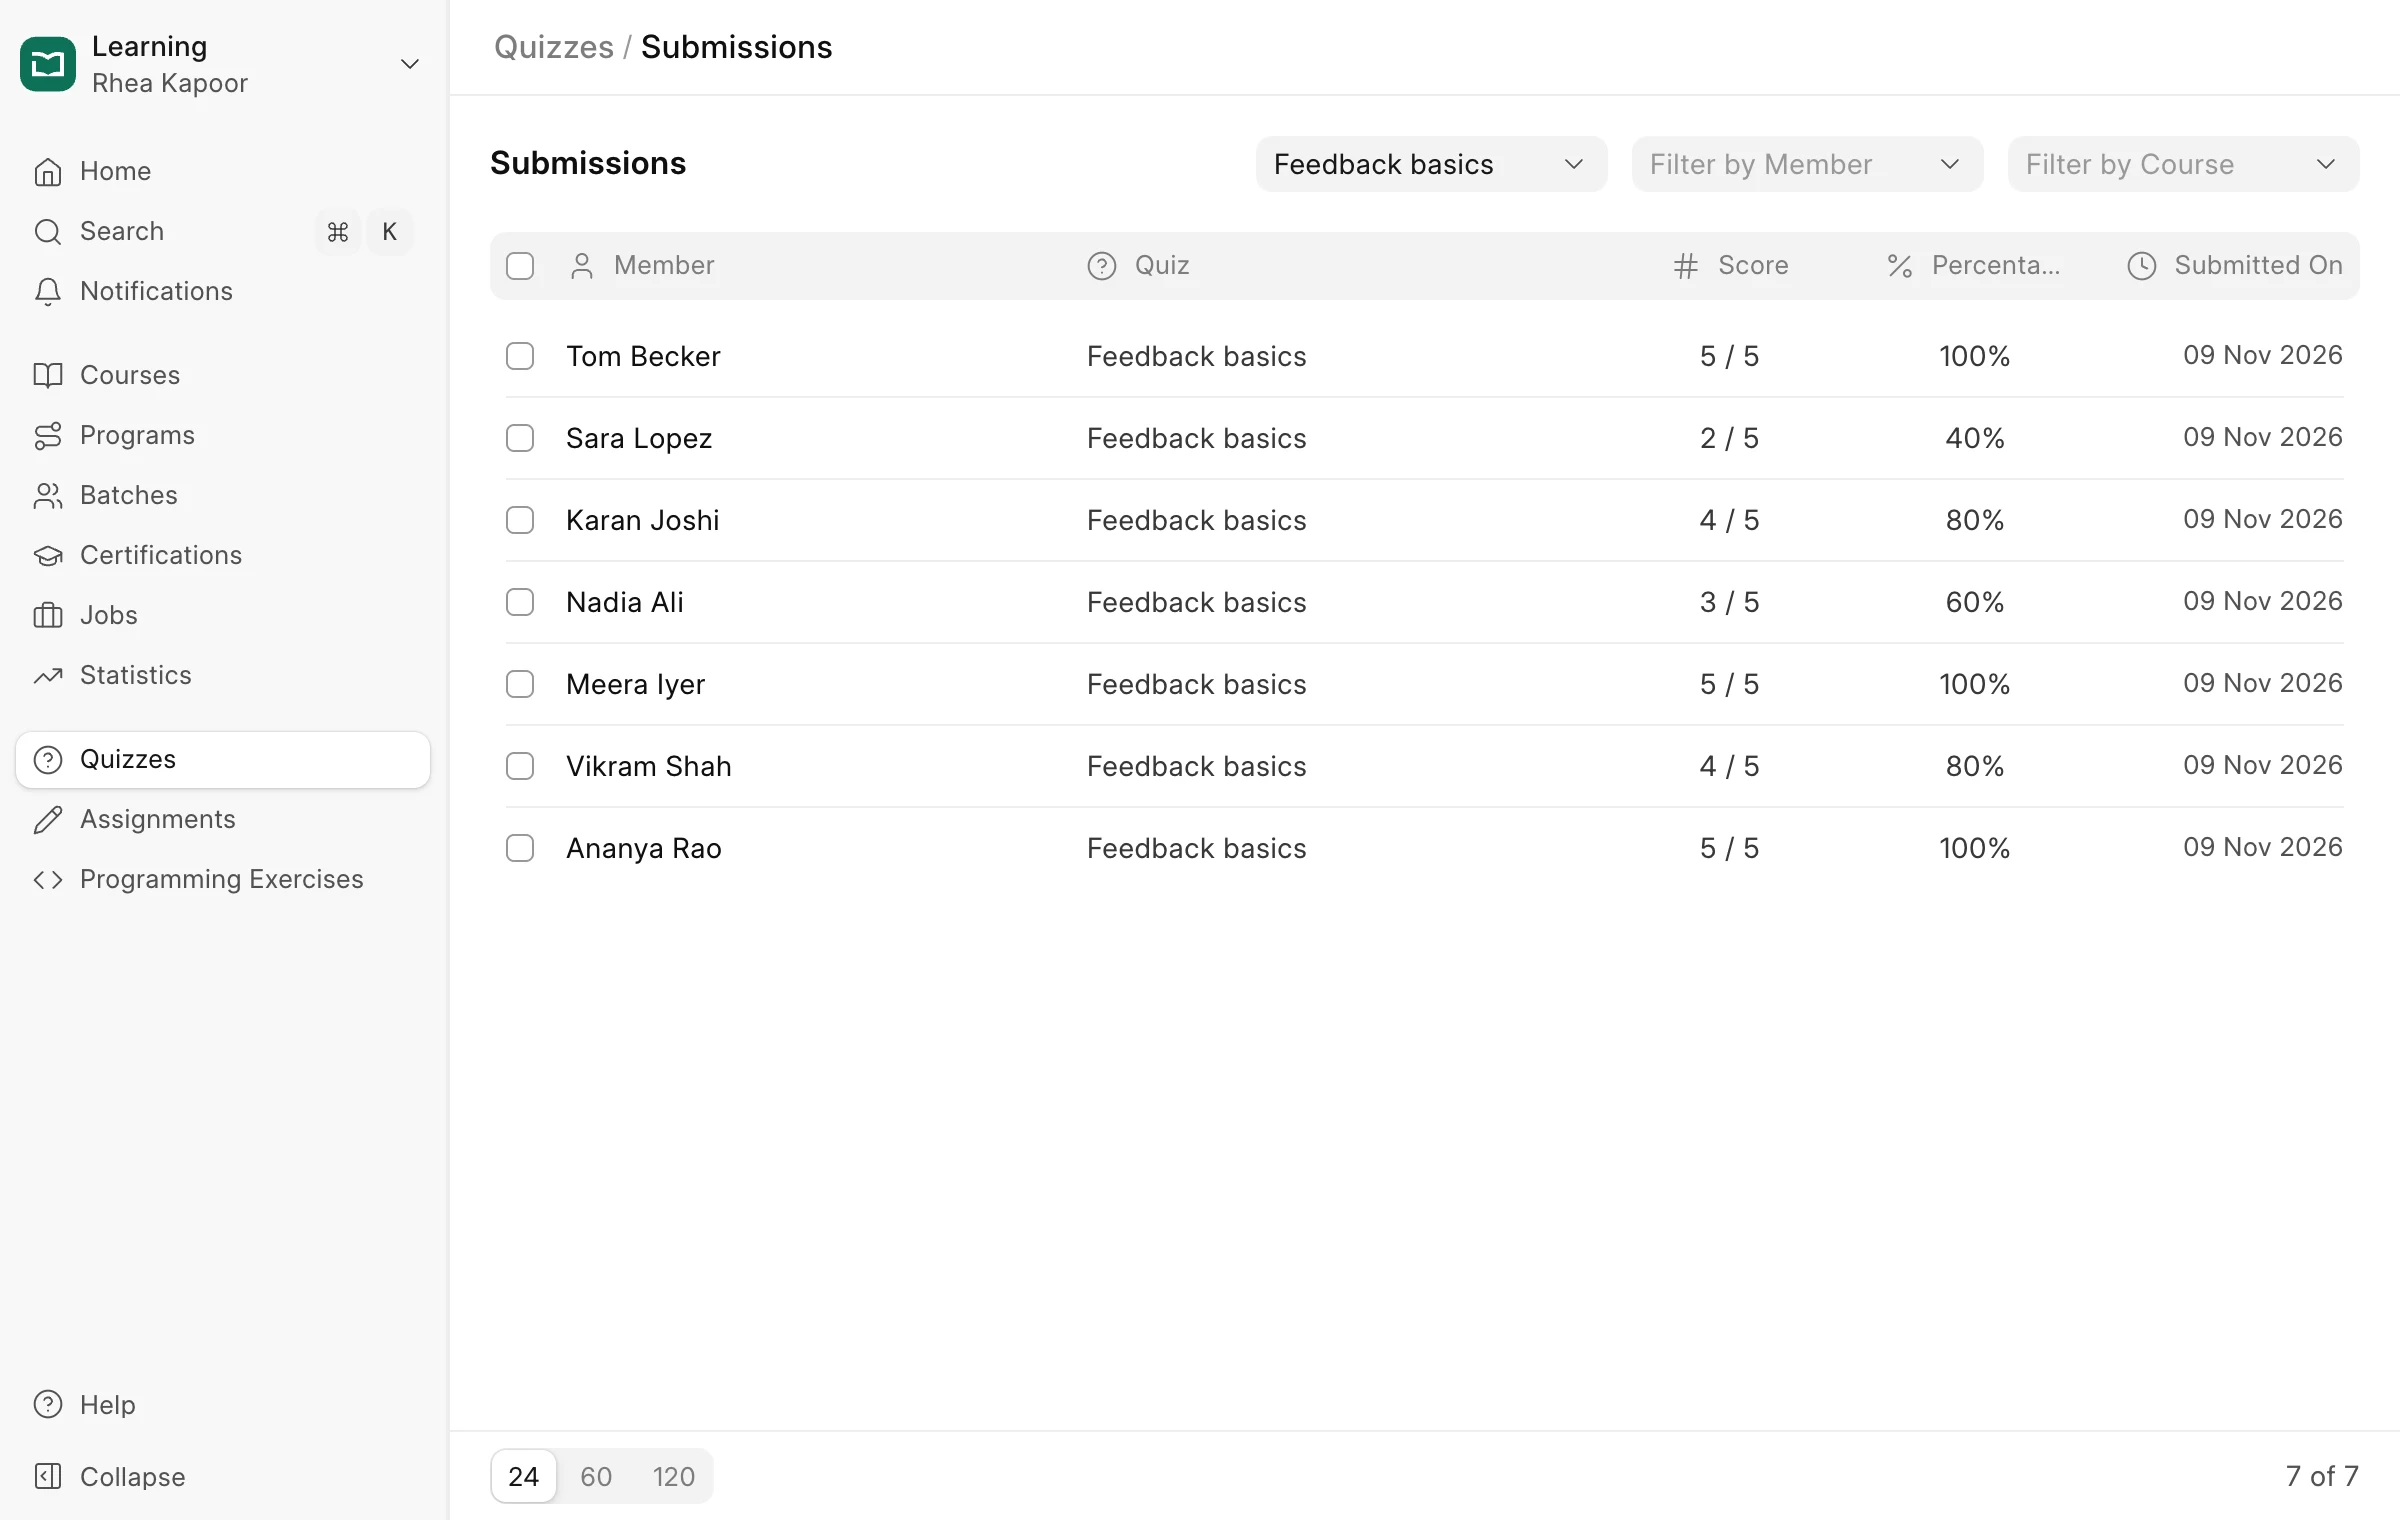
Quiz results in one list
Your whole academy at a glance
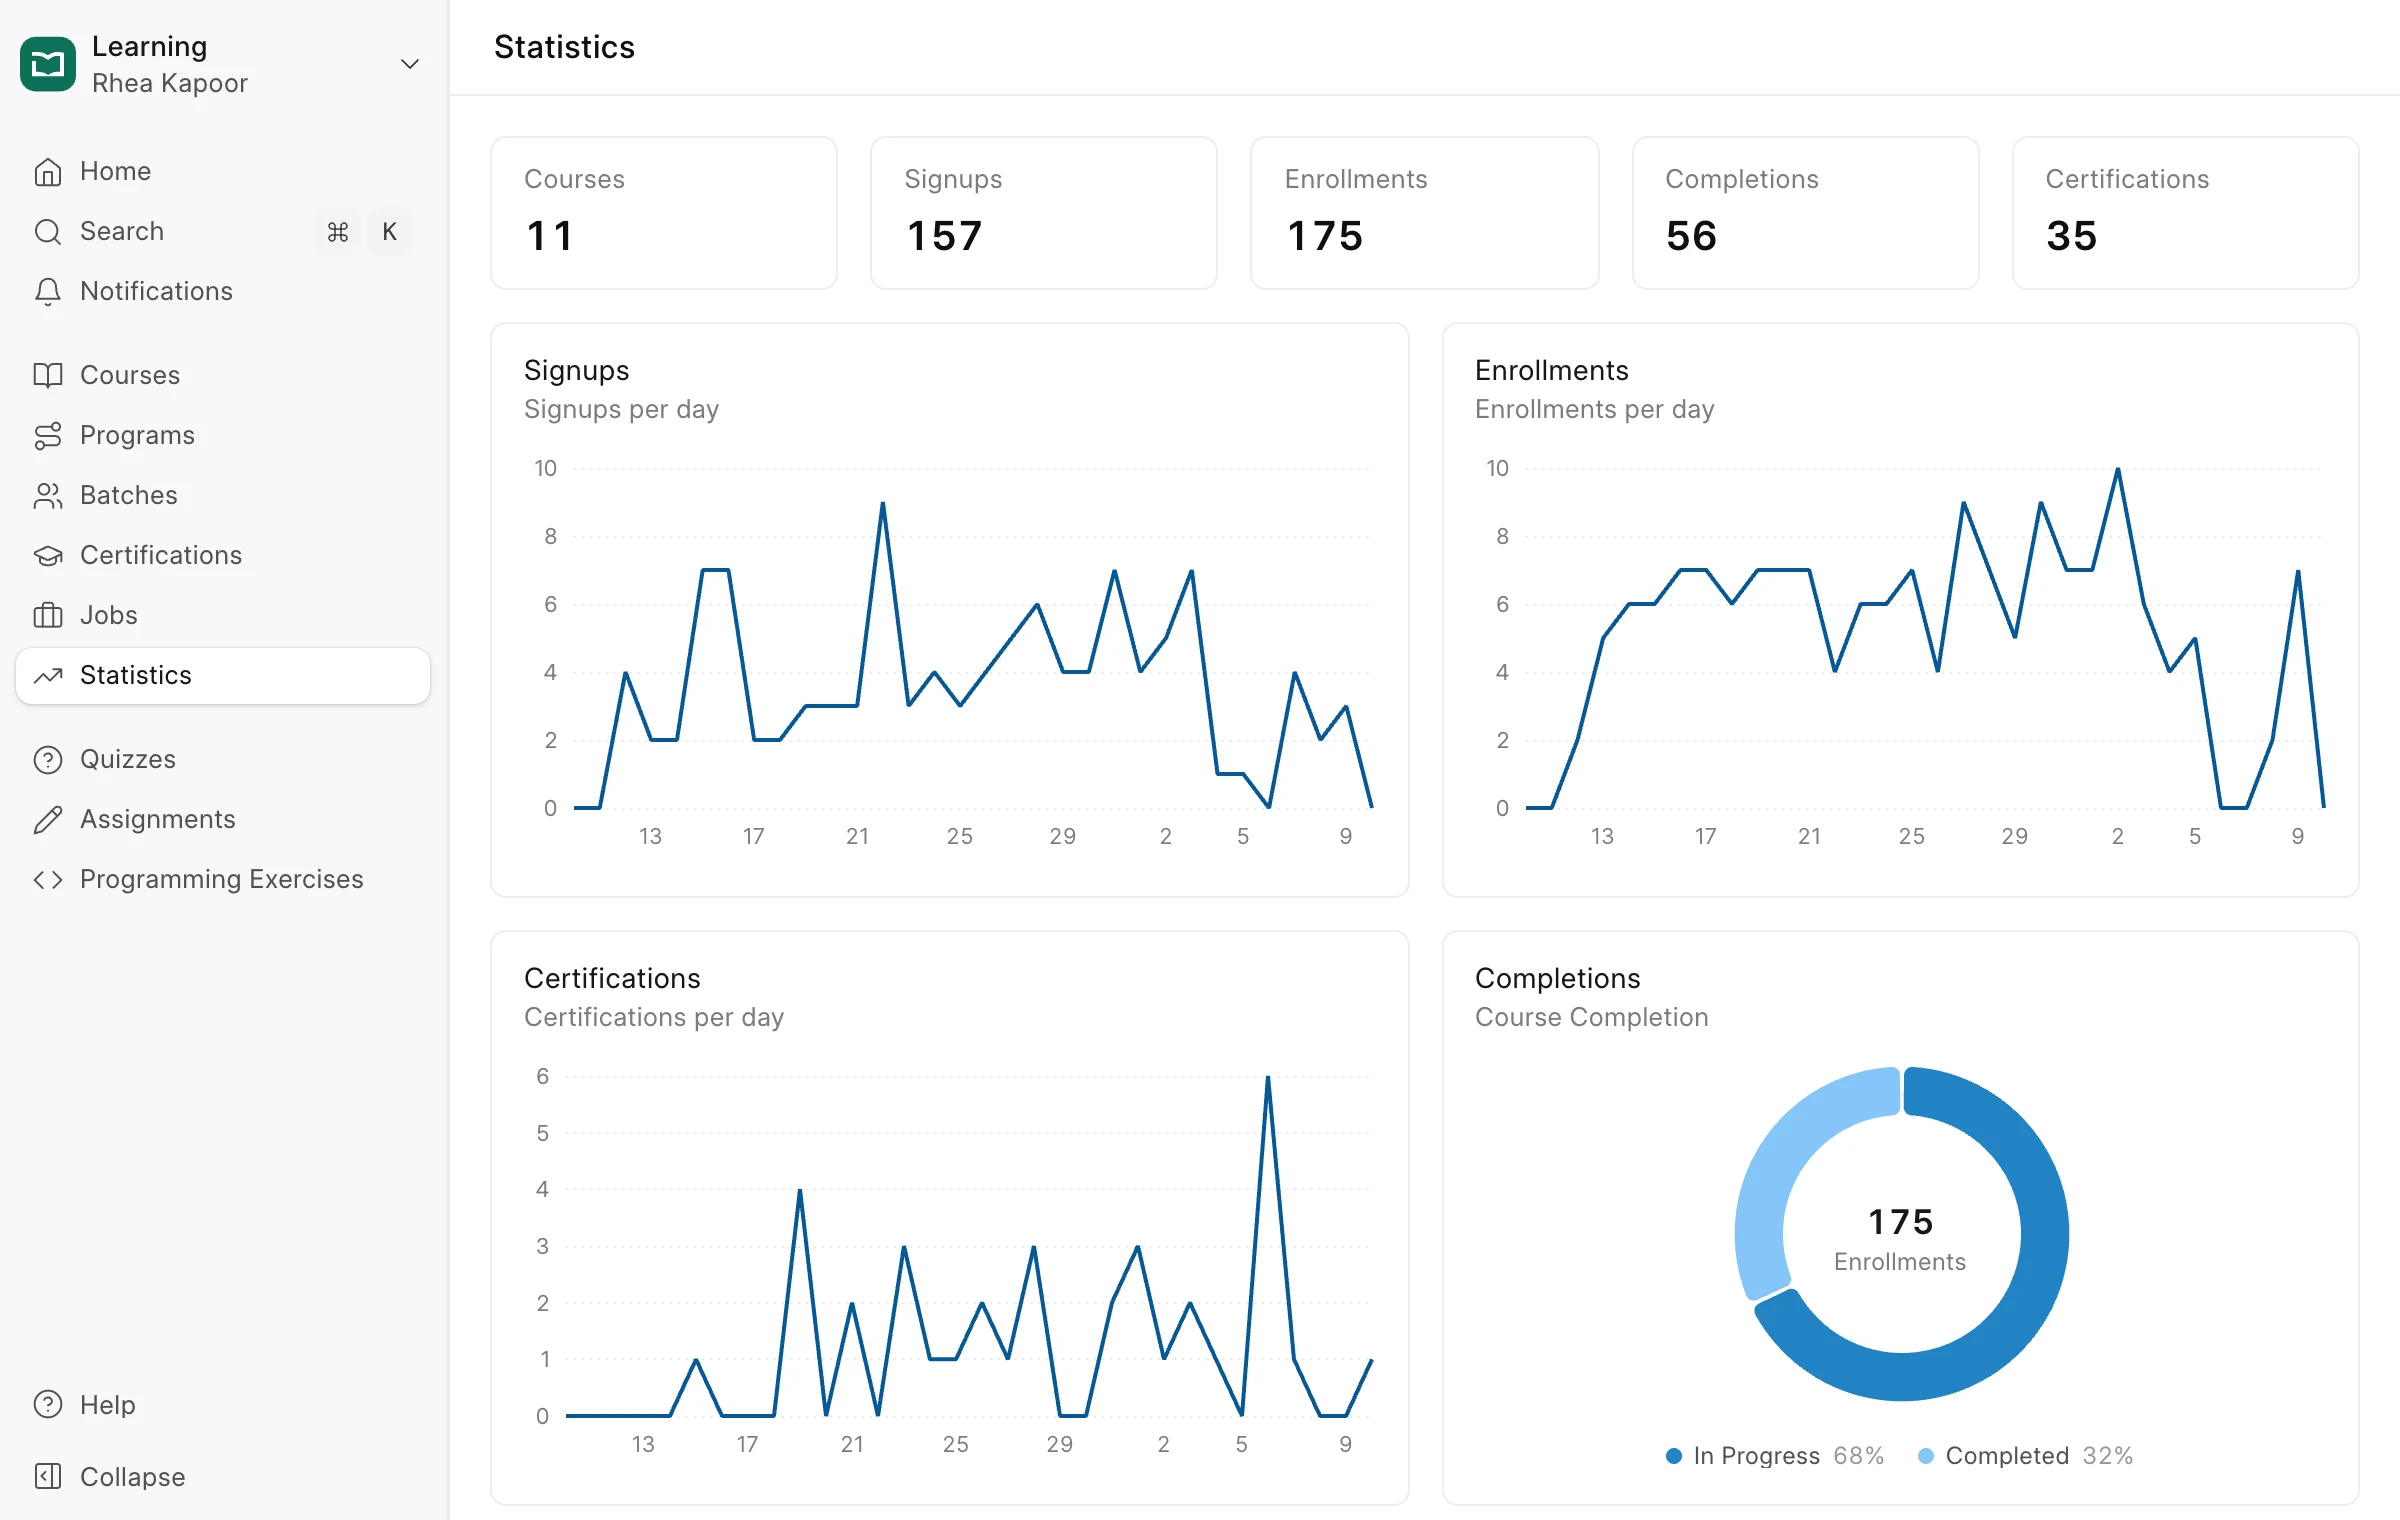
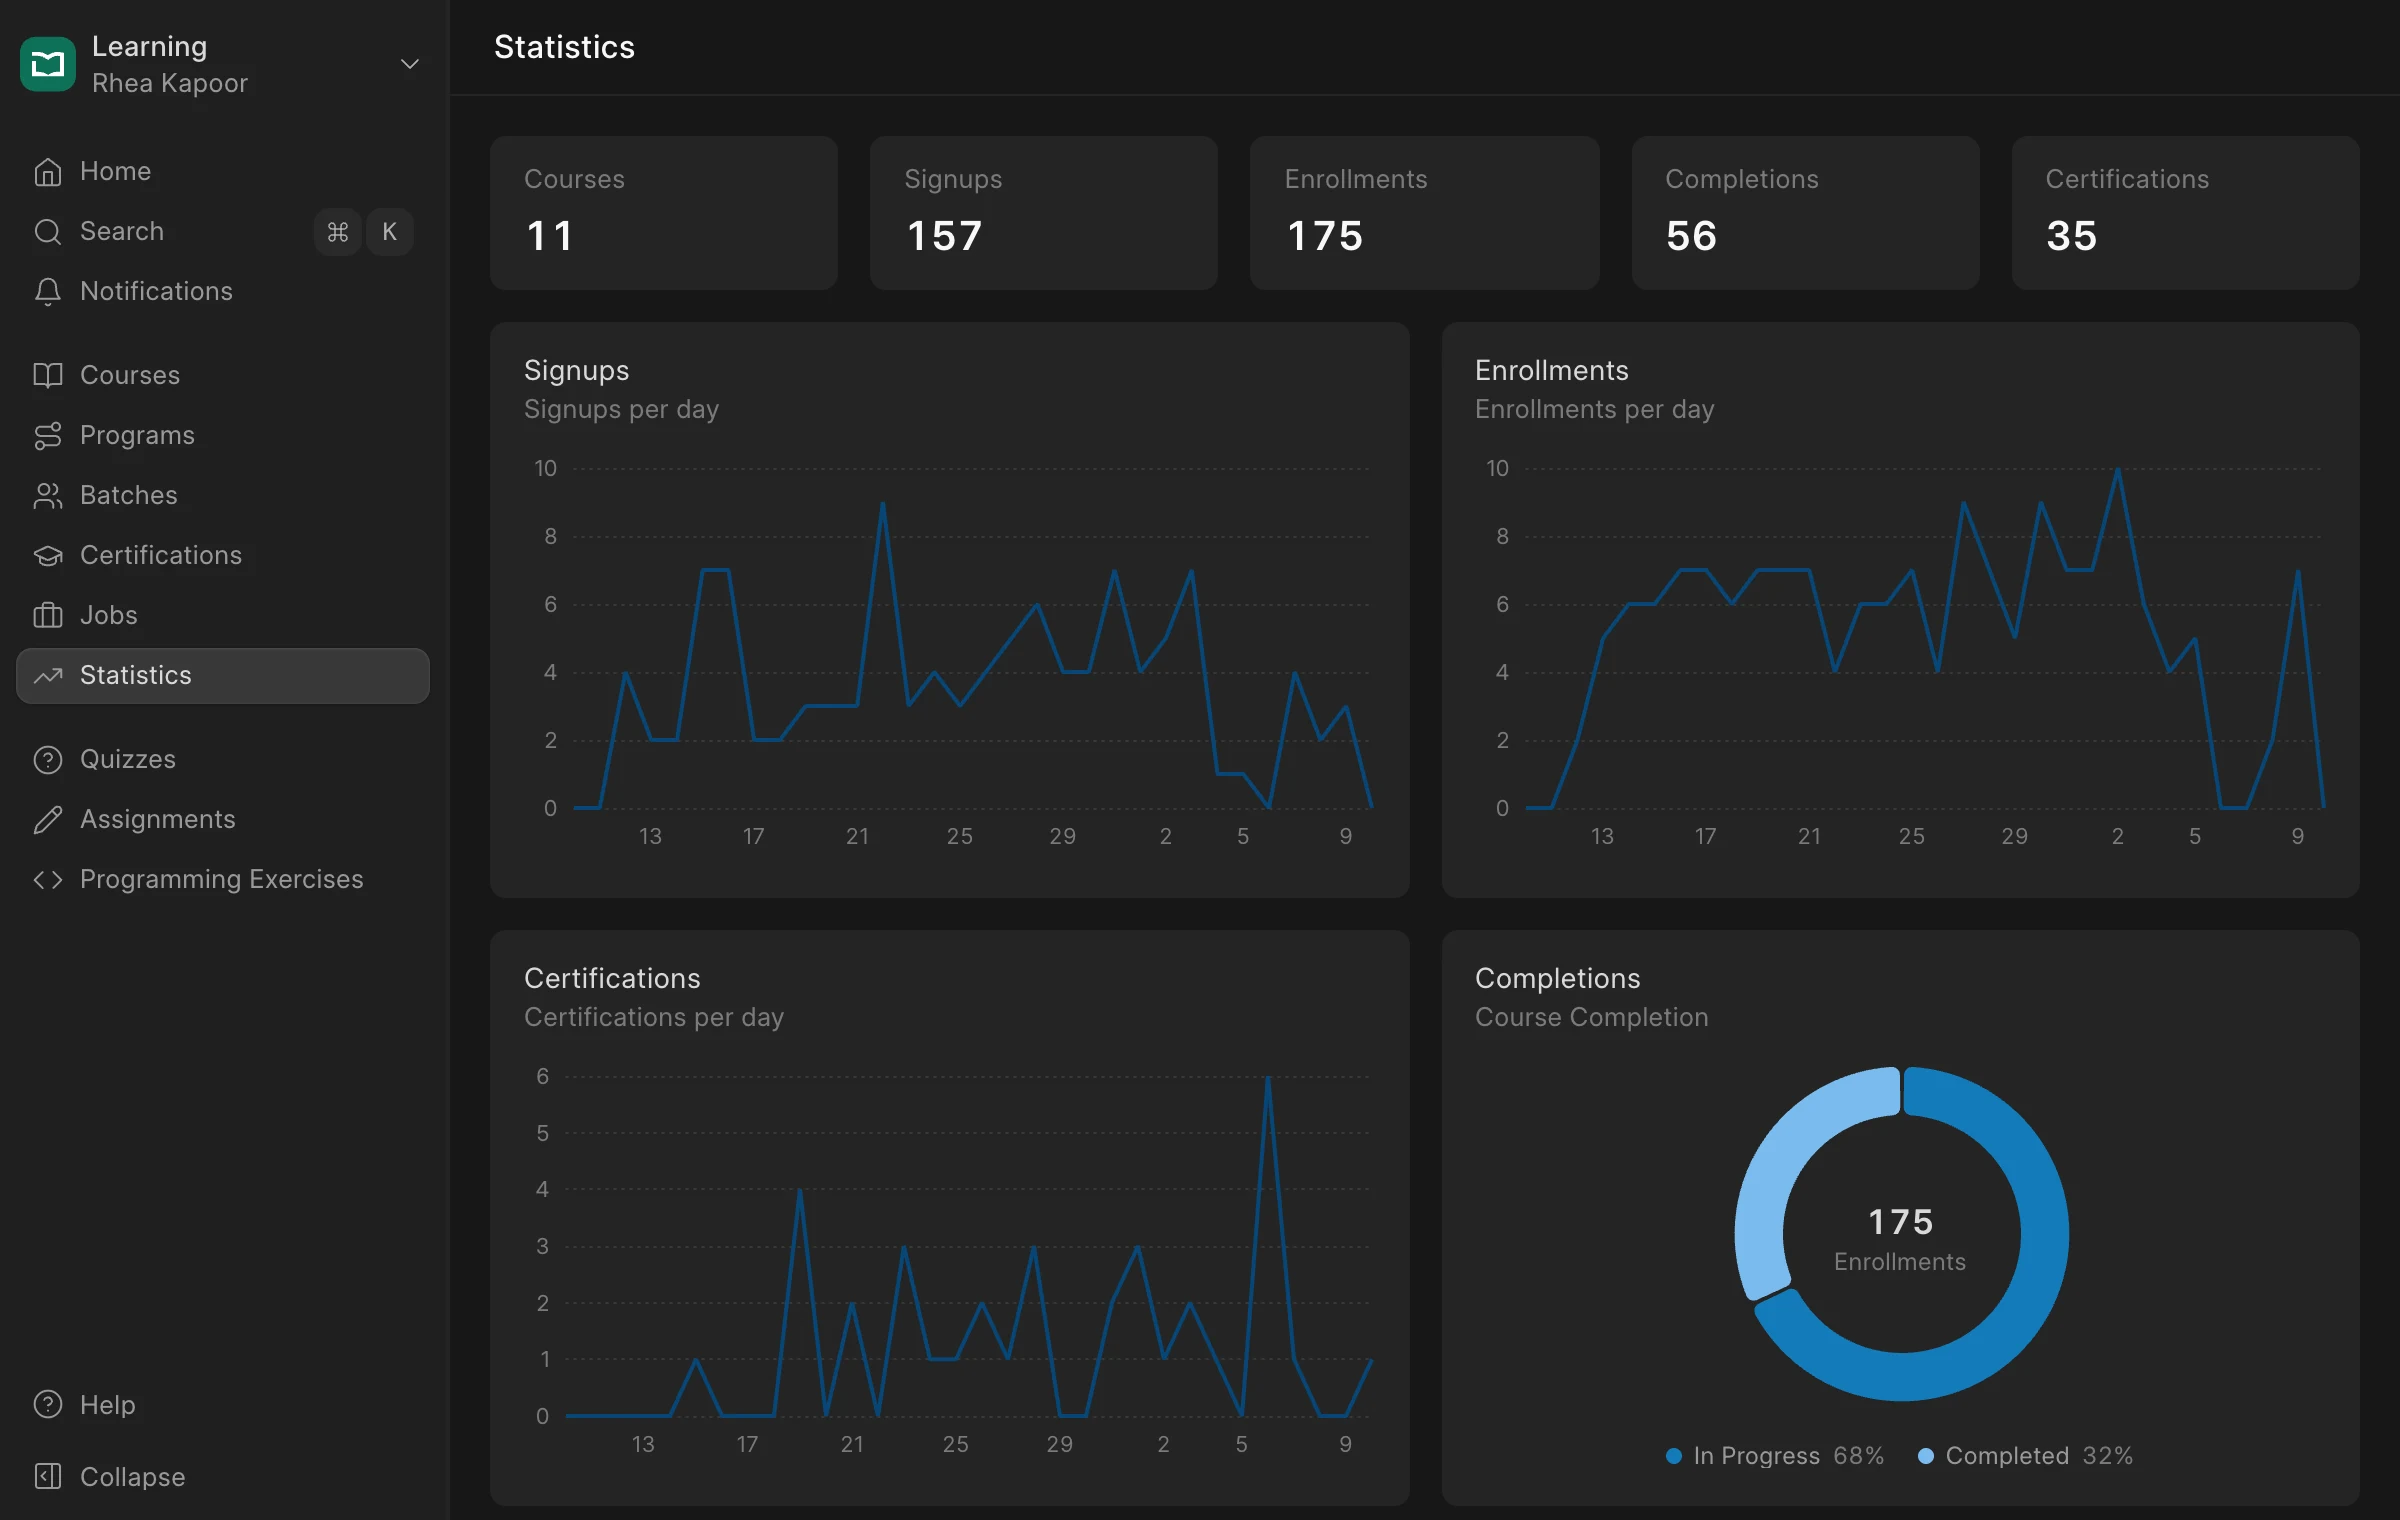
After a launch, the first question is usually “is anyone using this?”
The statistics page shows how many people signed up, enrolled, finished and got certified, with charts for each day of the last month. You can see whether a reminder email brought people back, or notice when sign-ups slow down.
How each course is going
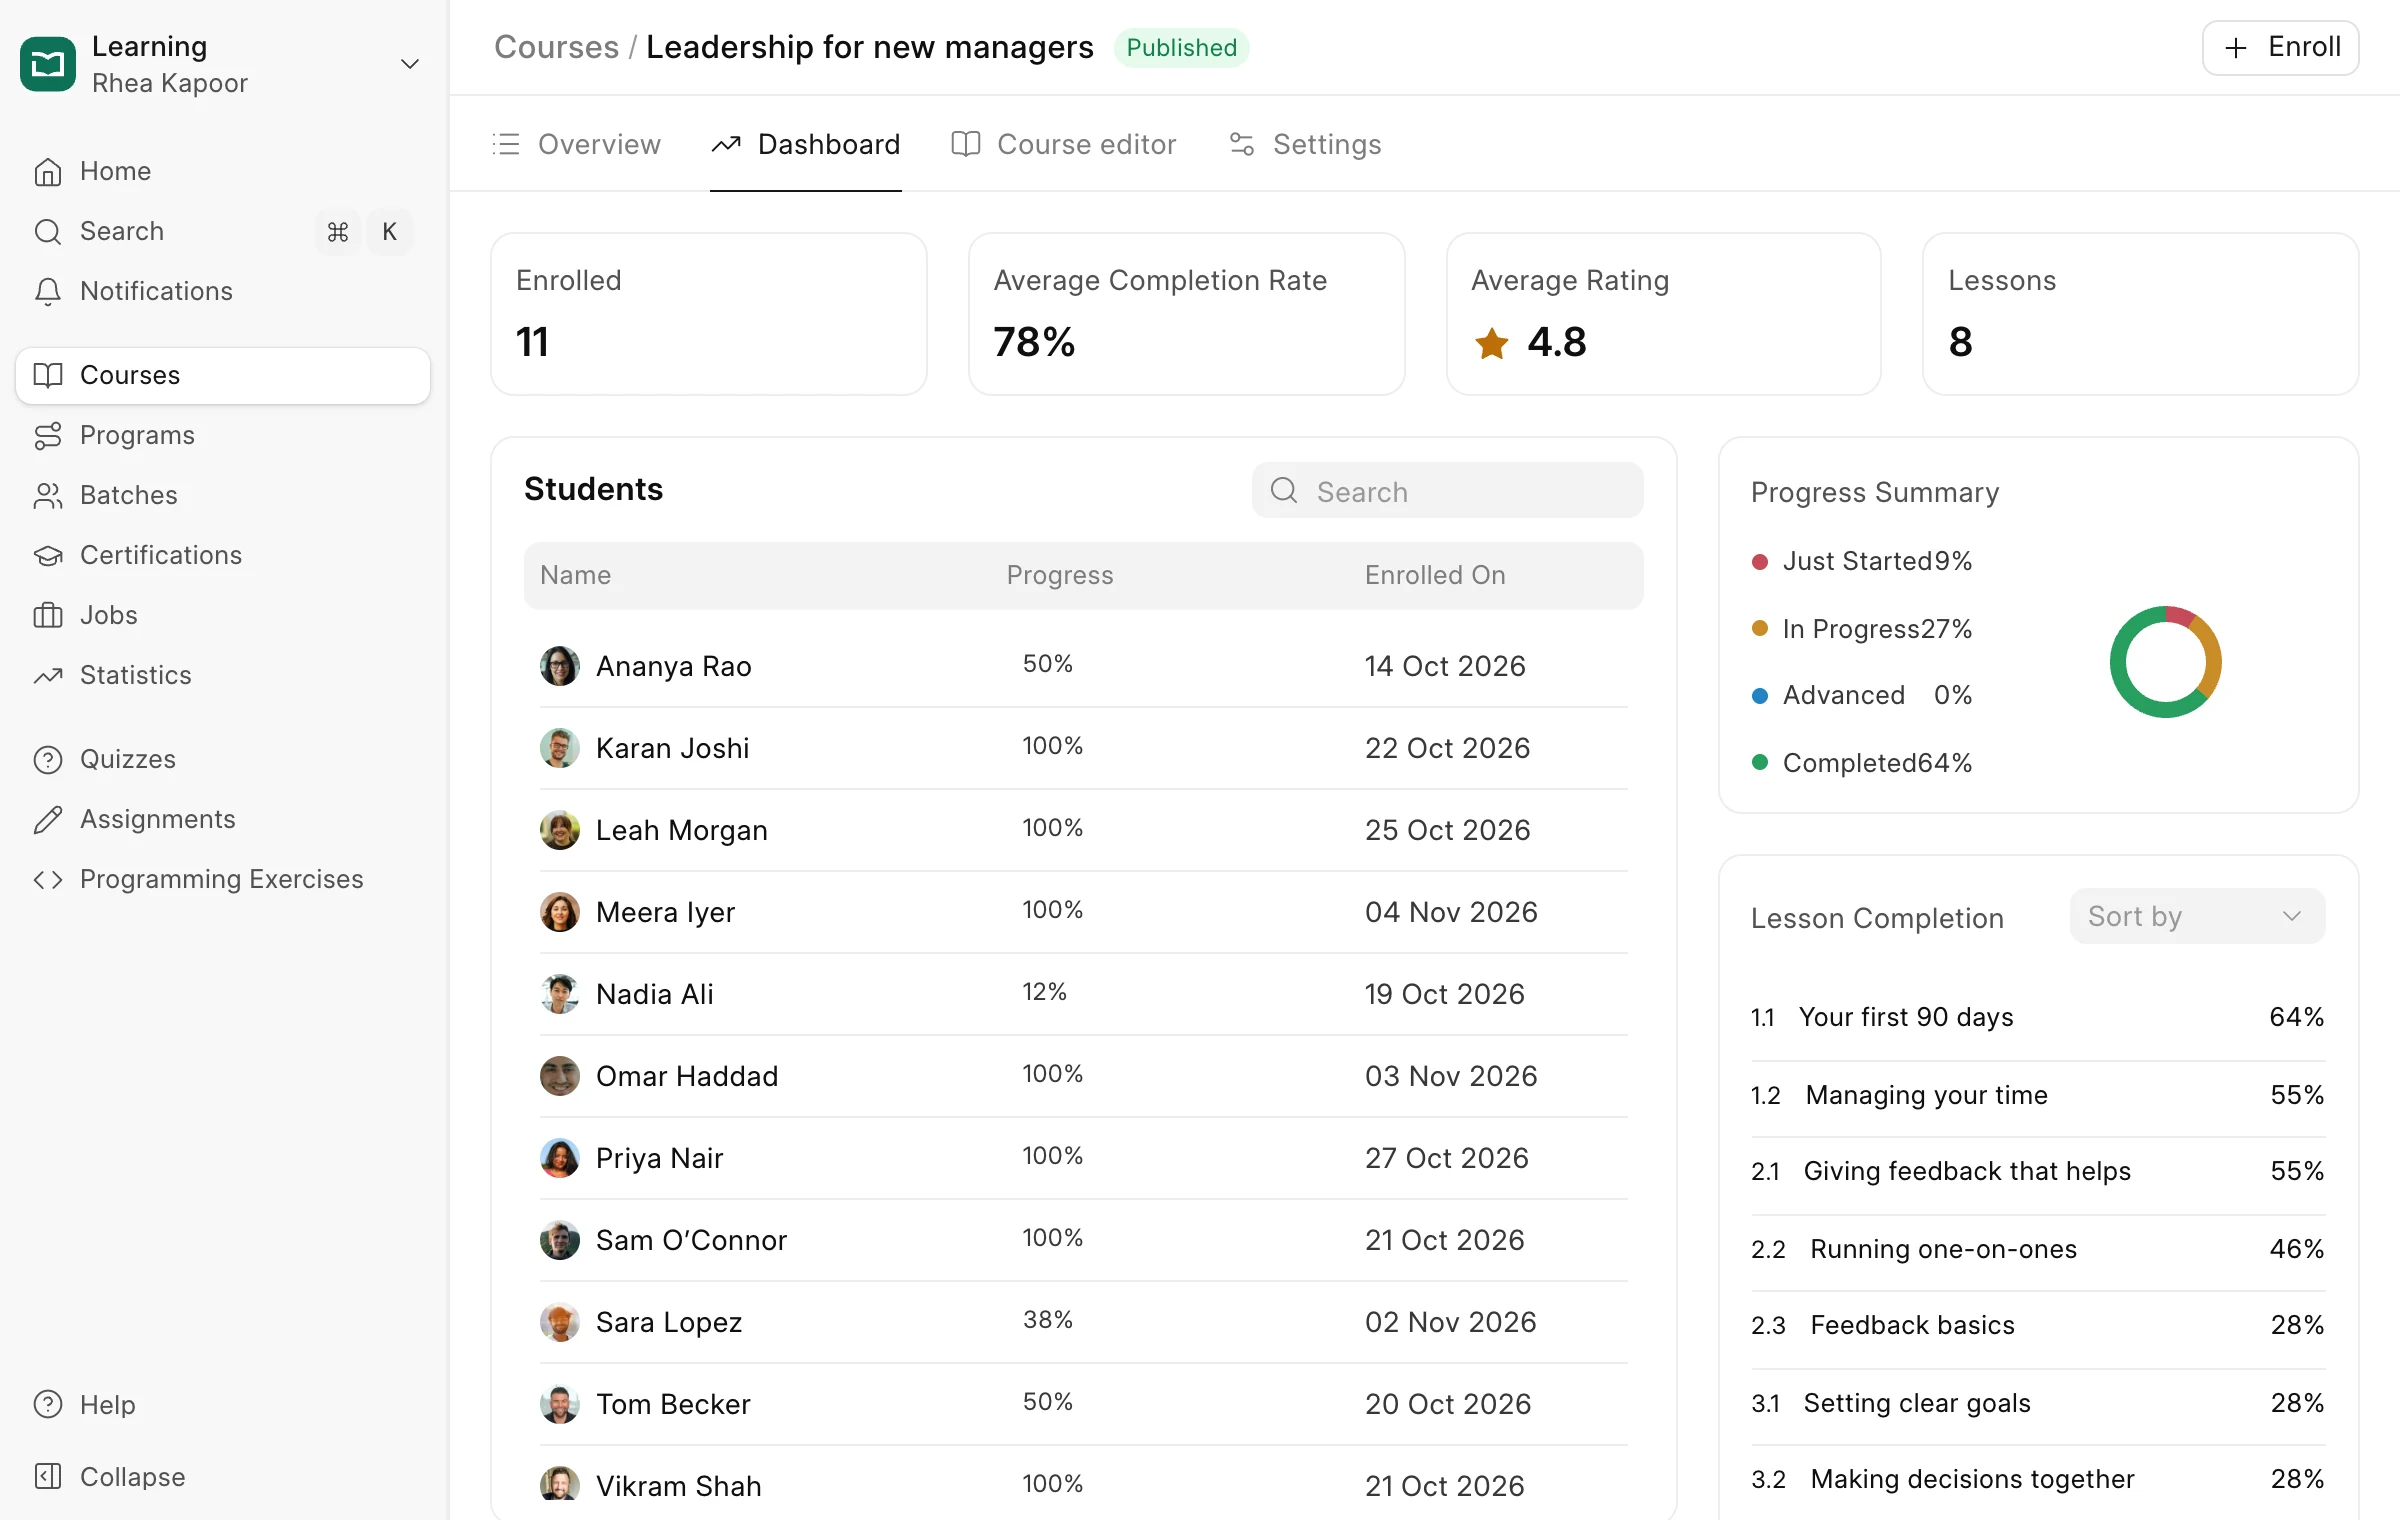
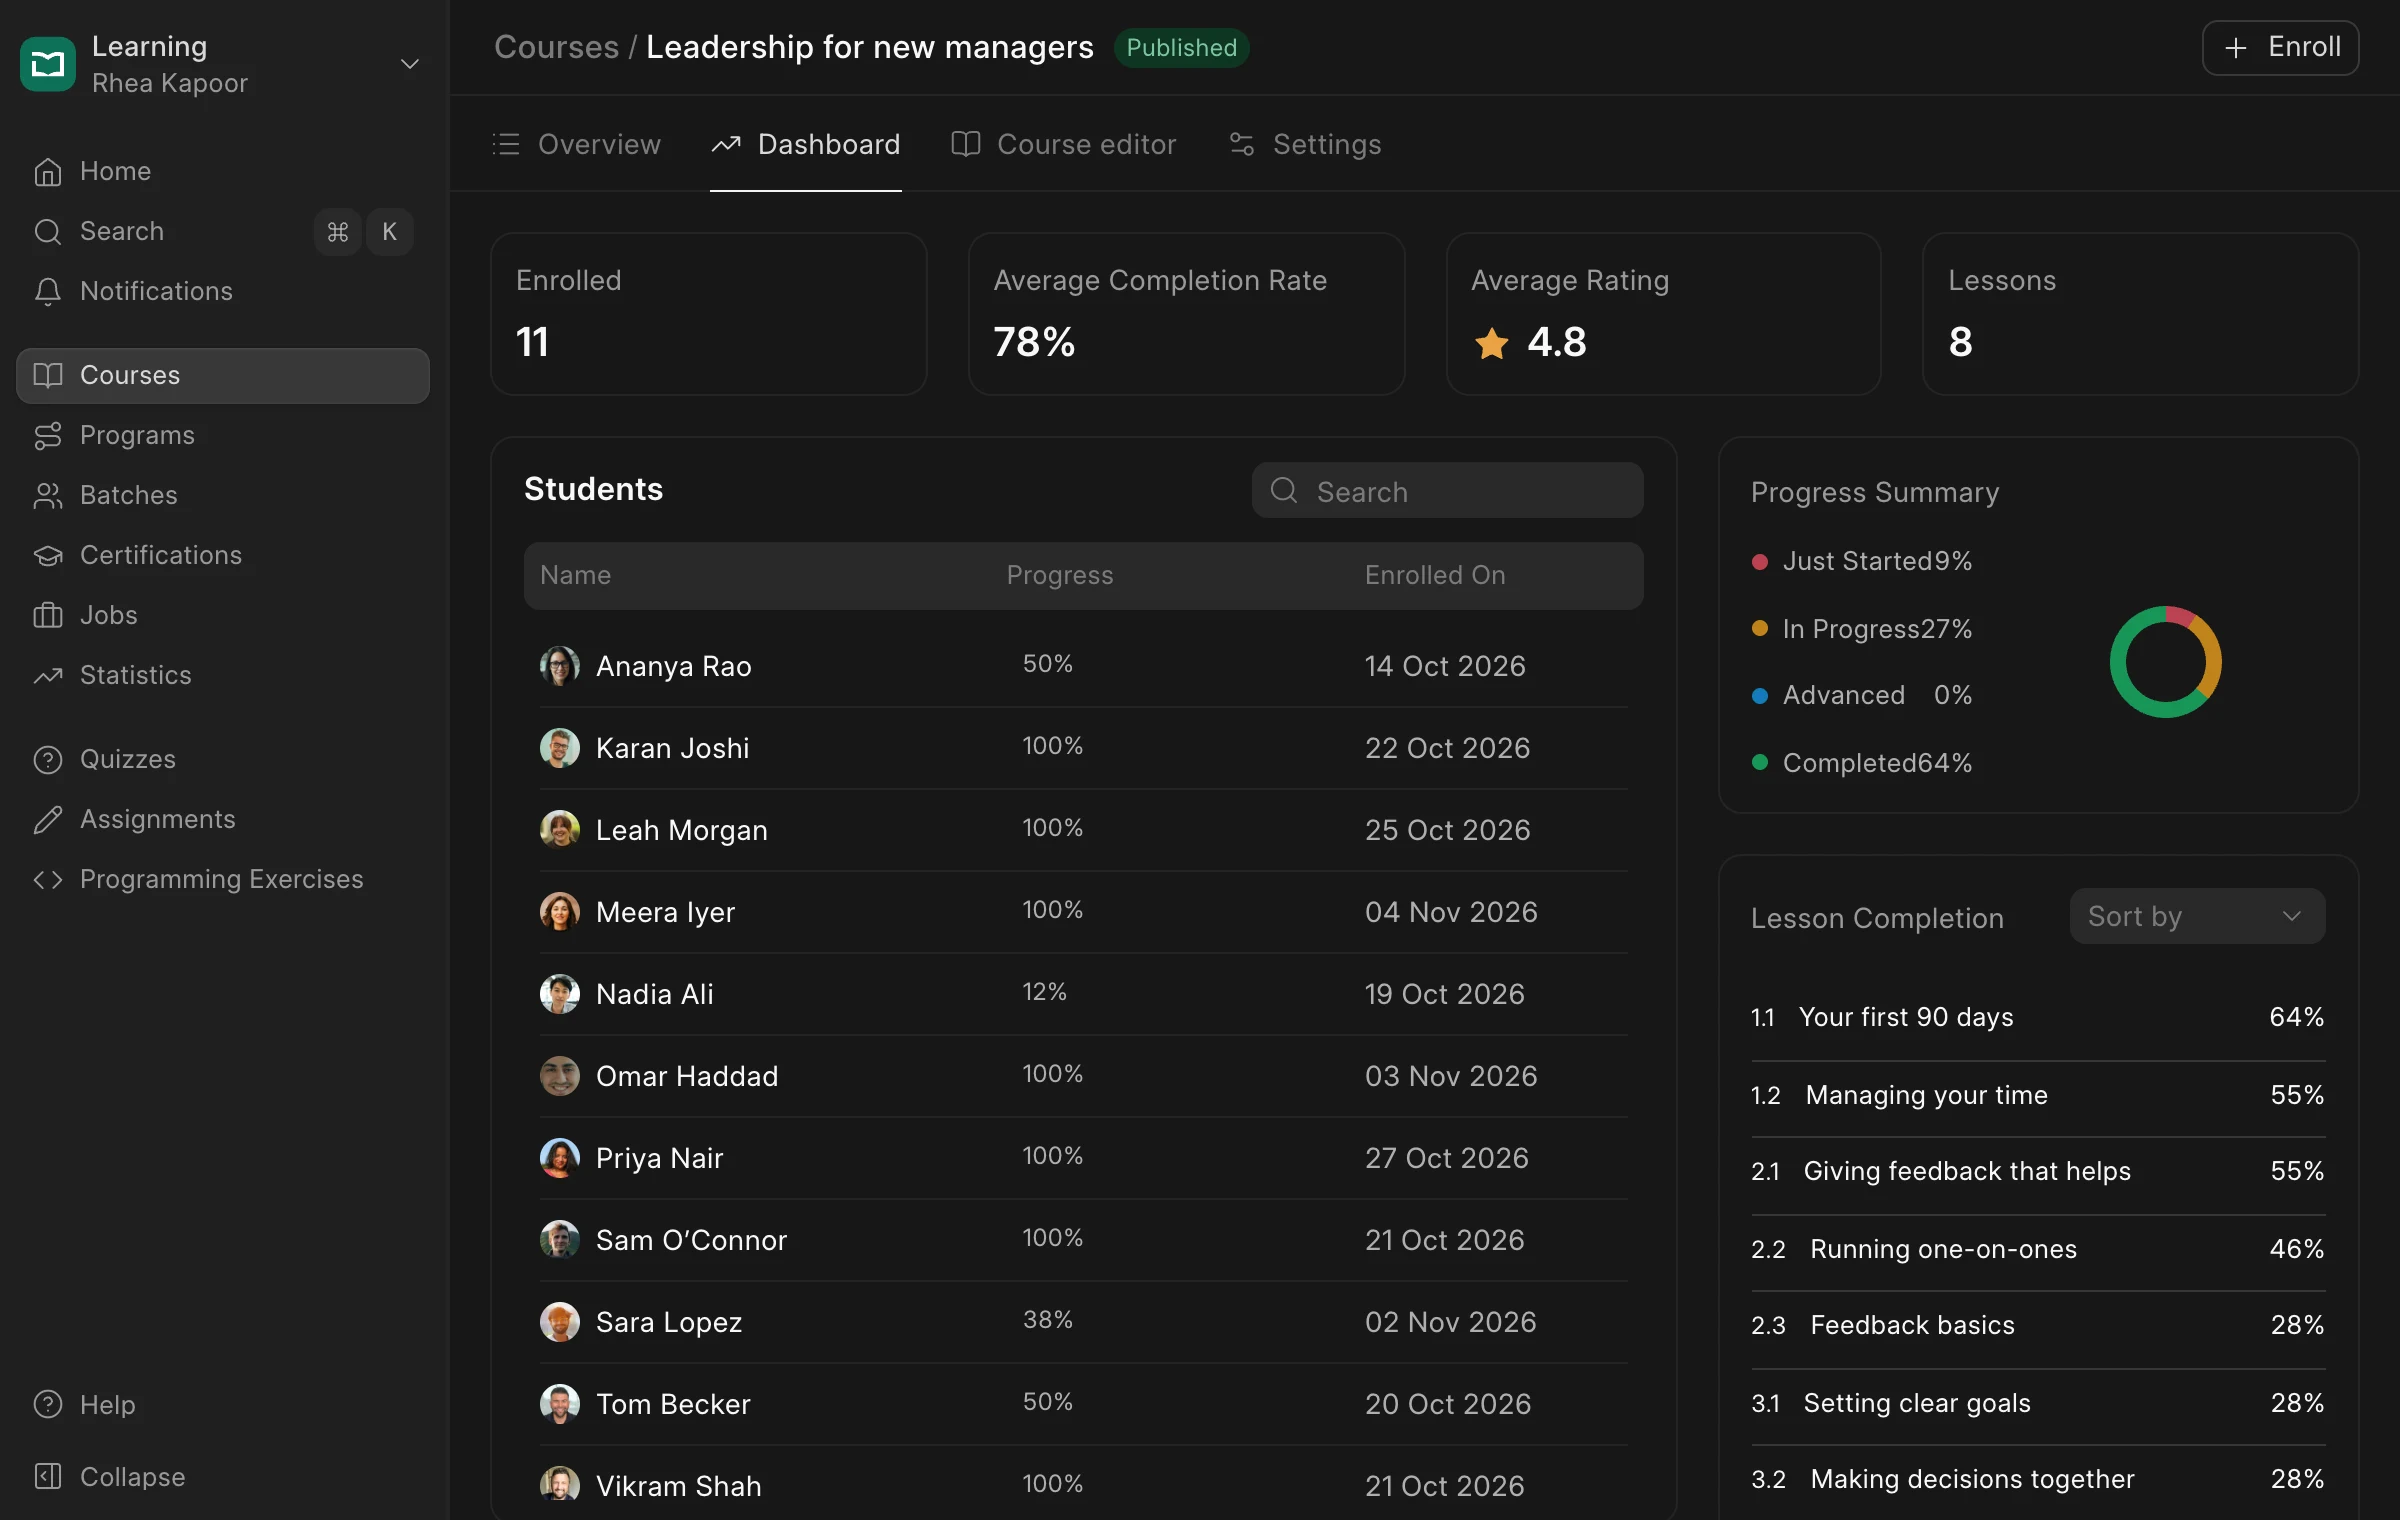
When a manager asks how their new hires are doing, you shouldn’t need a spreadsheet to answer.
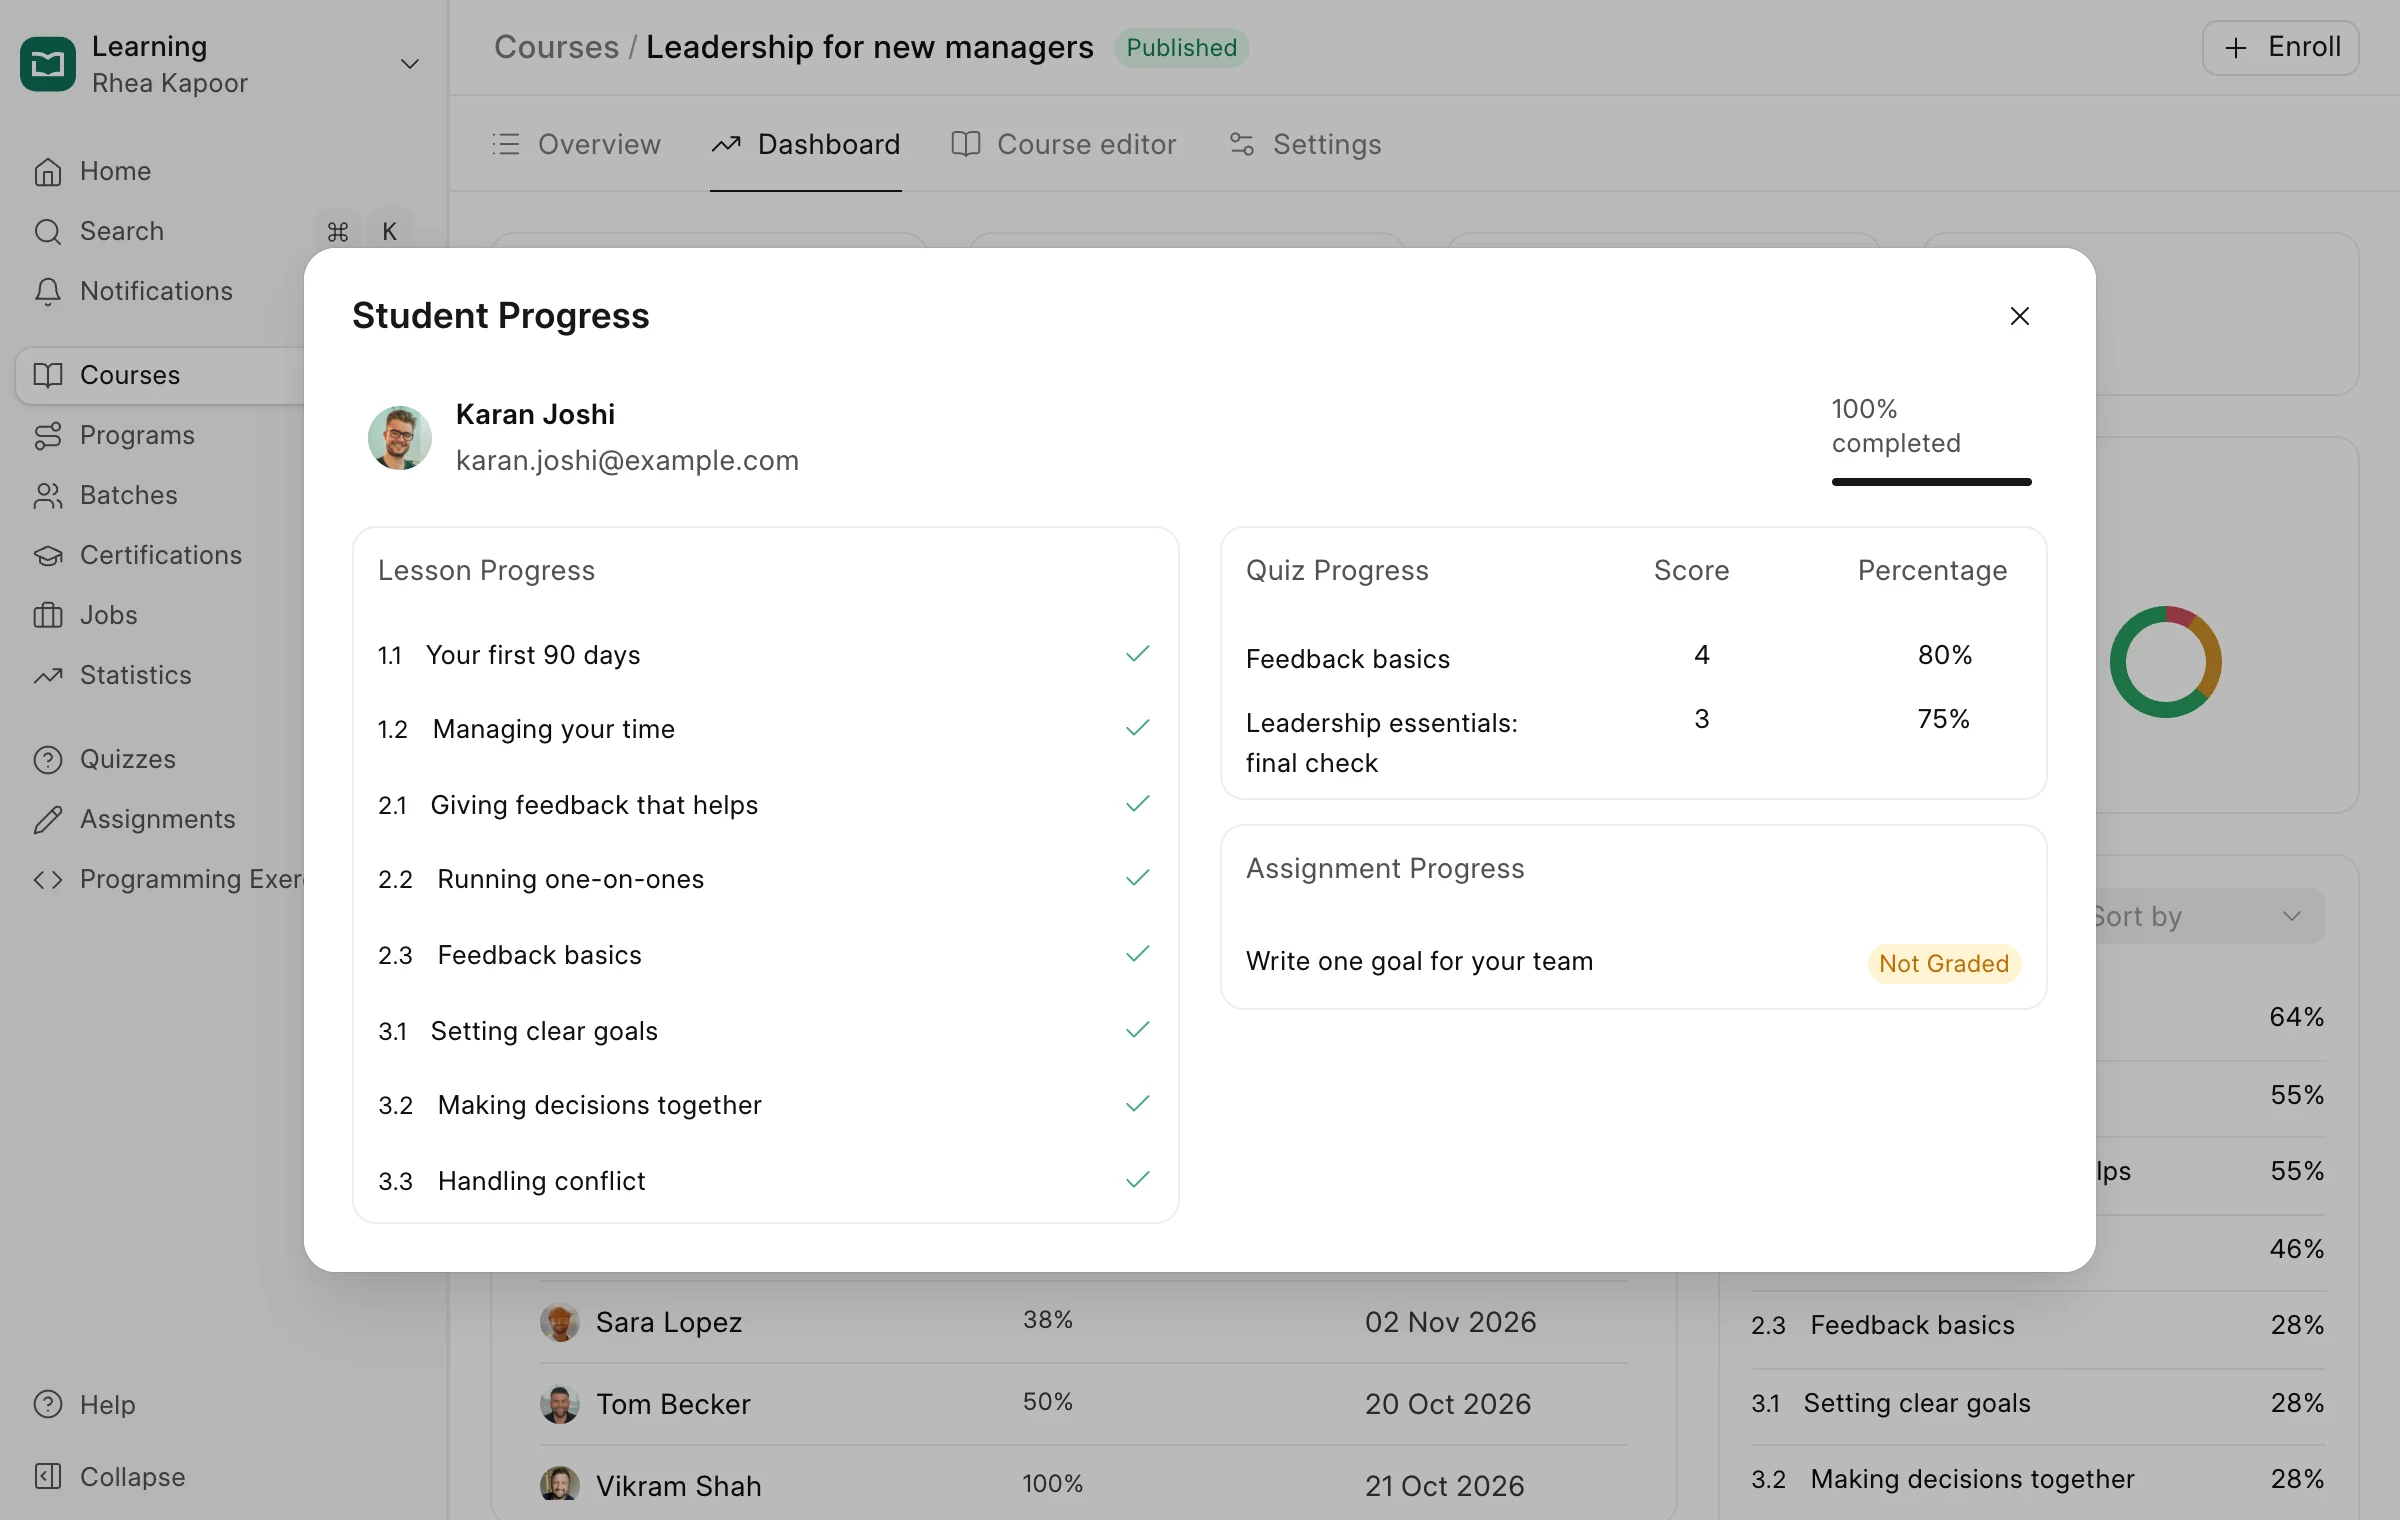
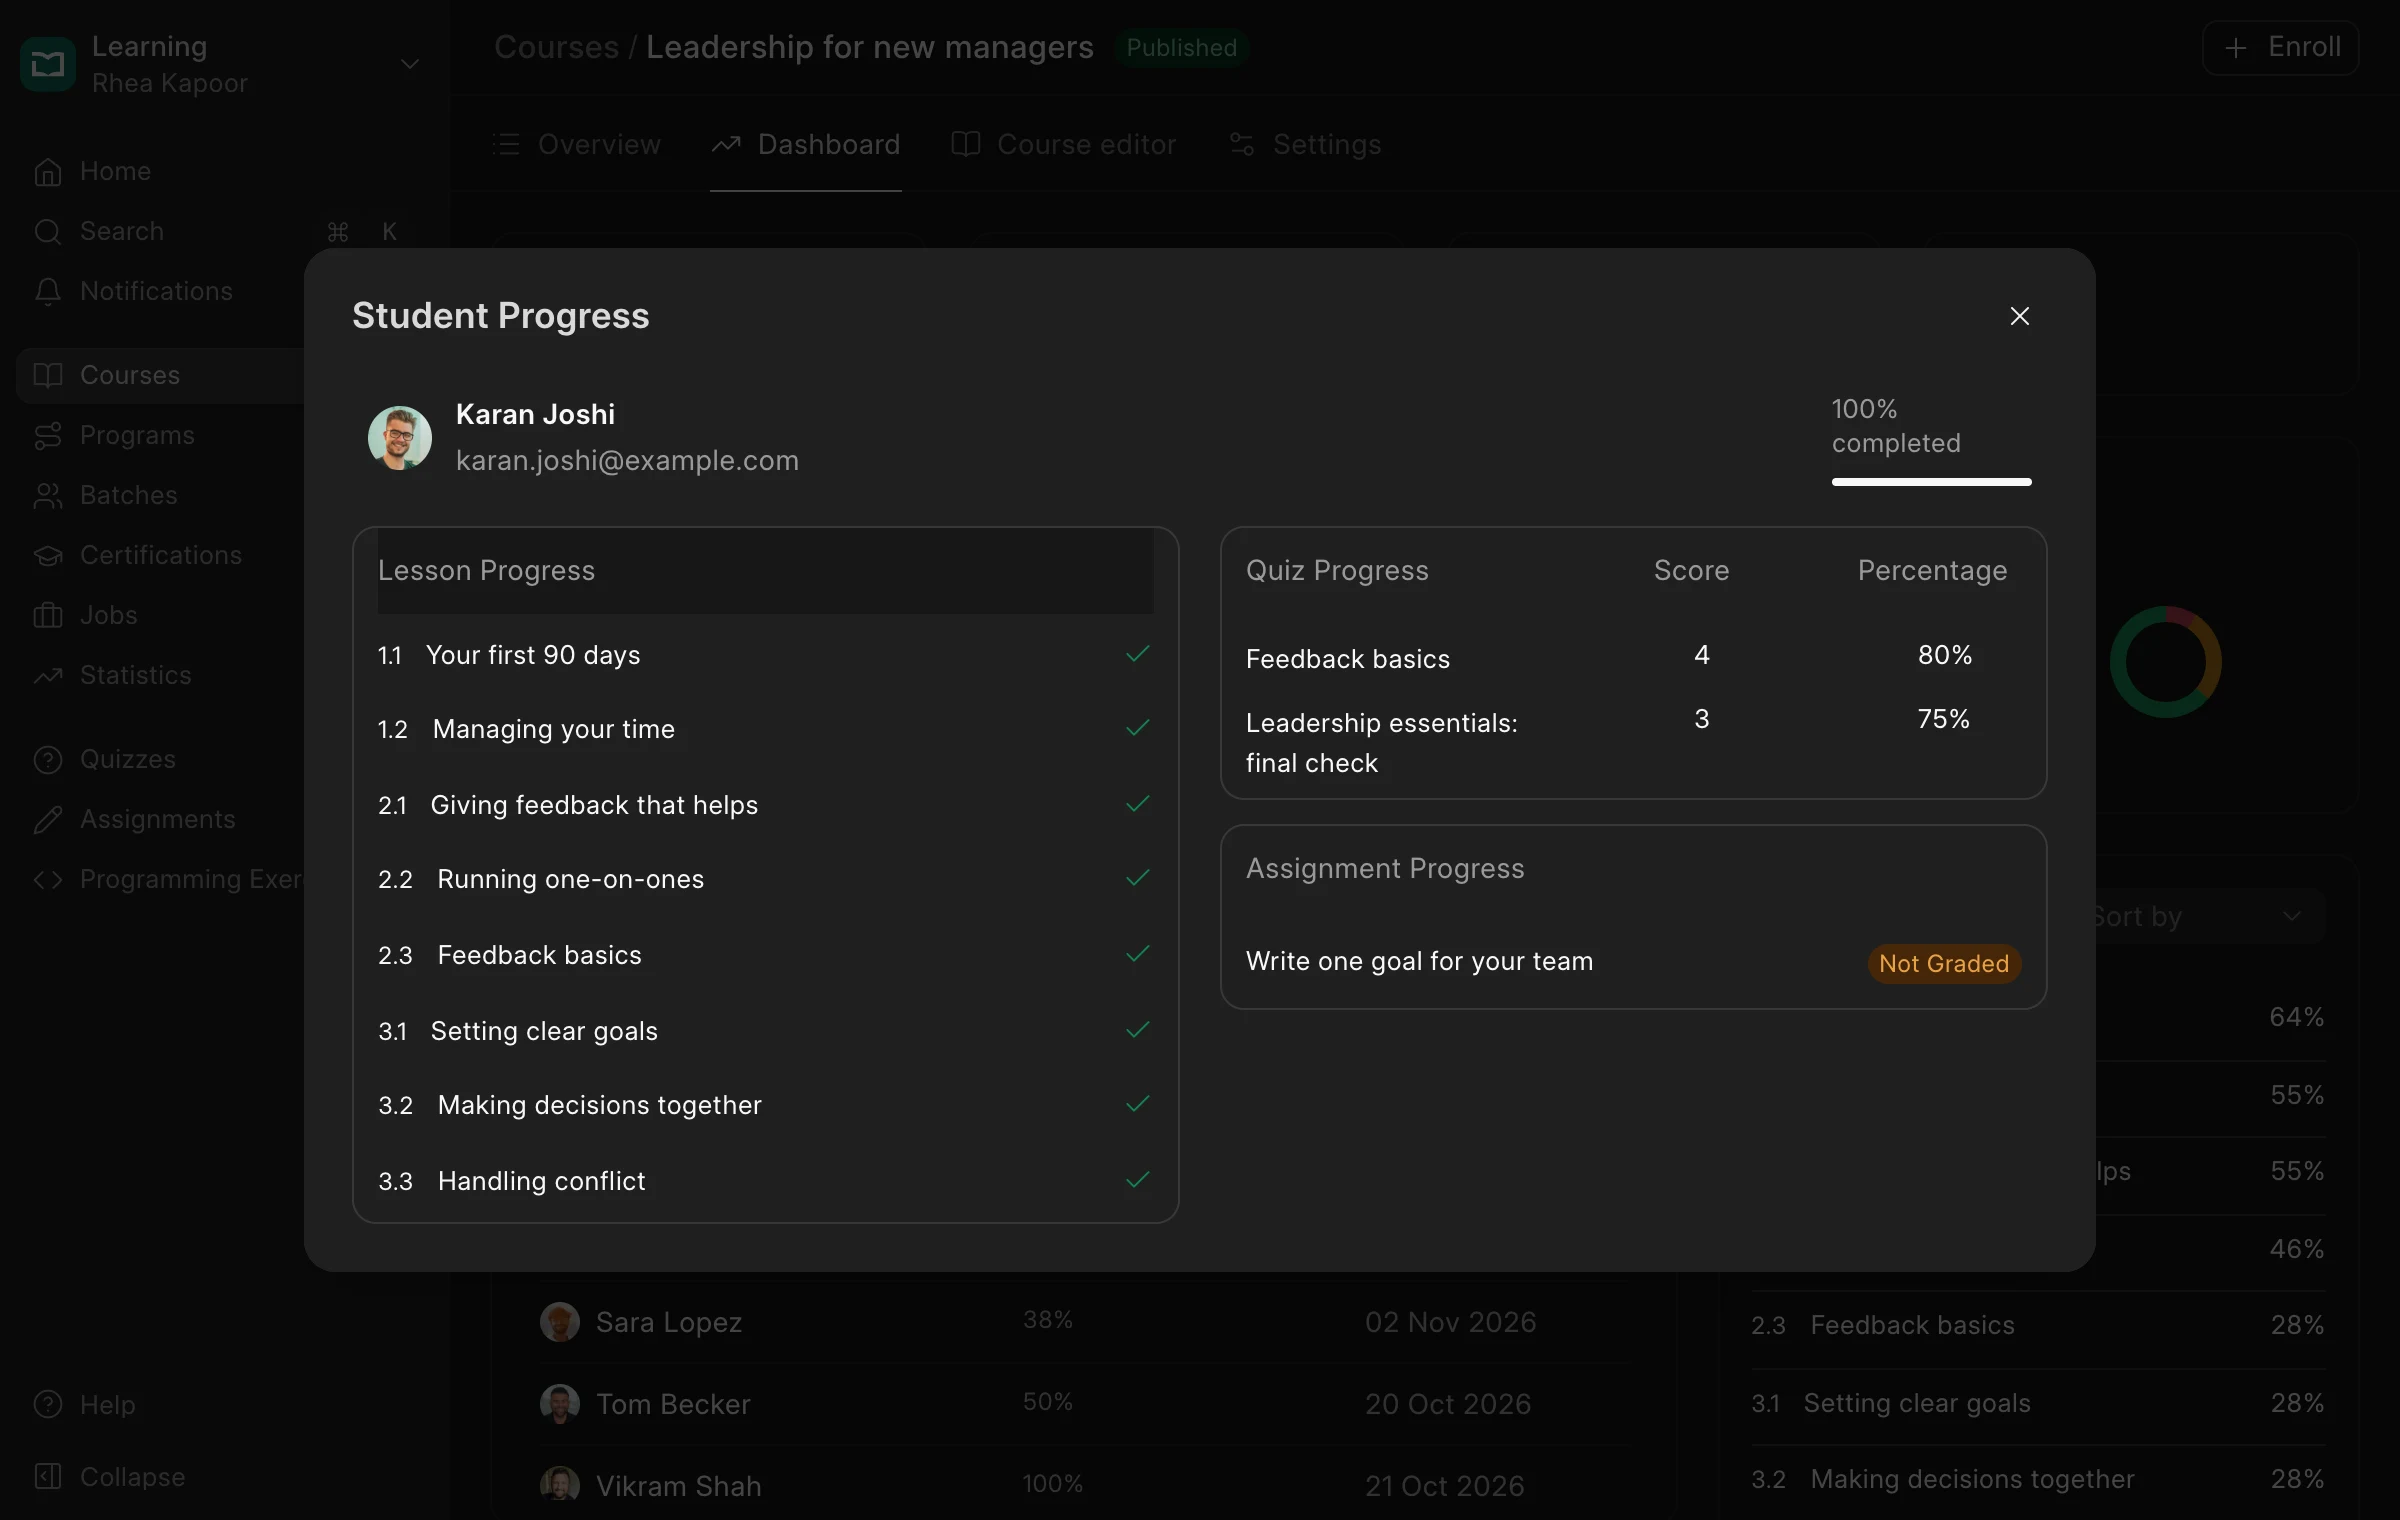
Each course has a dashboard with every learner’s progress, the completion rate and the rating. Lesson completion shows where people stop, and clicking a learner shows their progress lesson by lesson with their quiz and assignment results.
Who’s on track in a batch
For a cohort or a training program, you want to know who’s on track before the next live session, not after it ends.
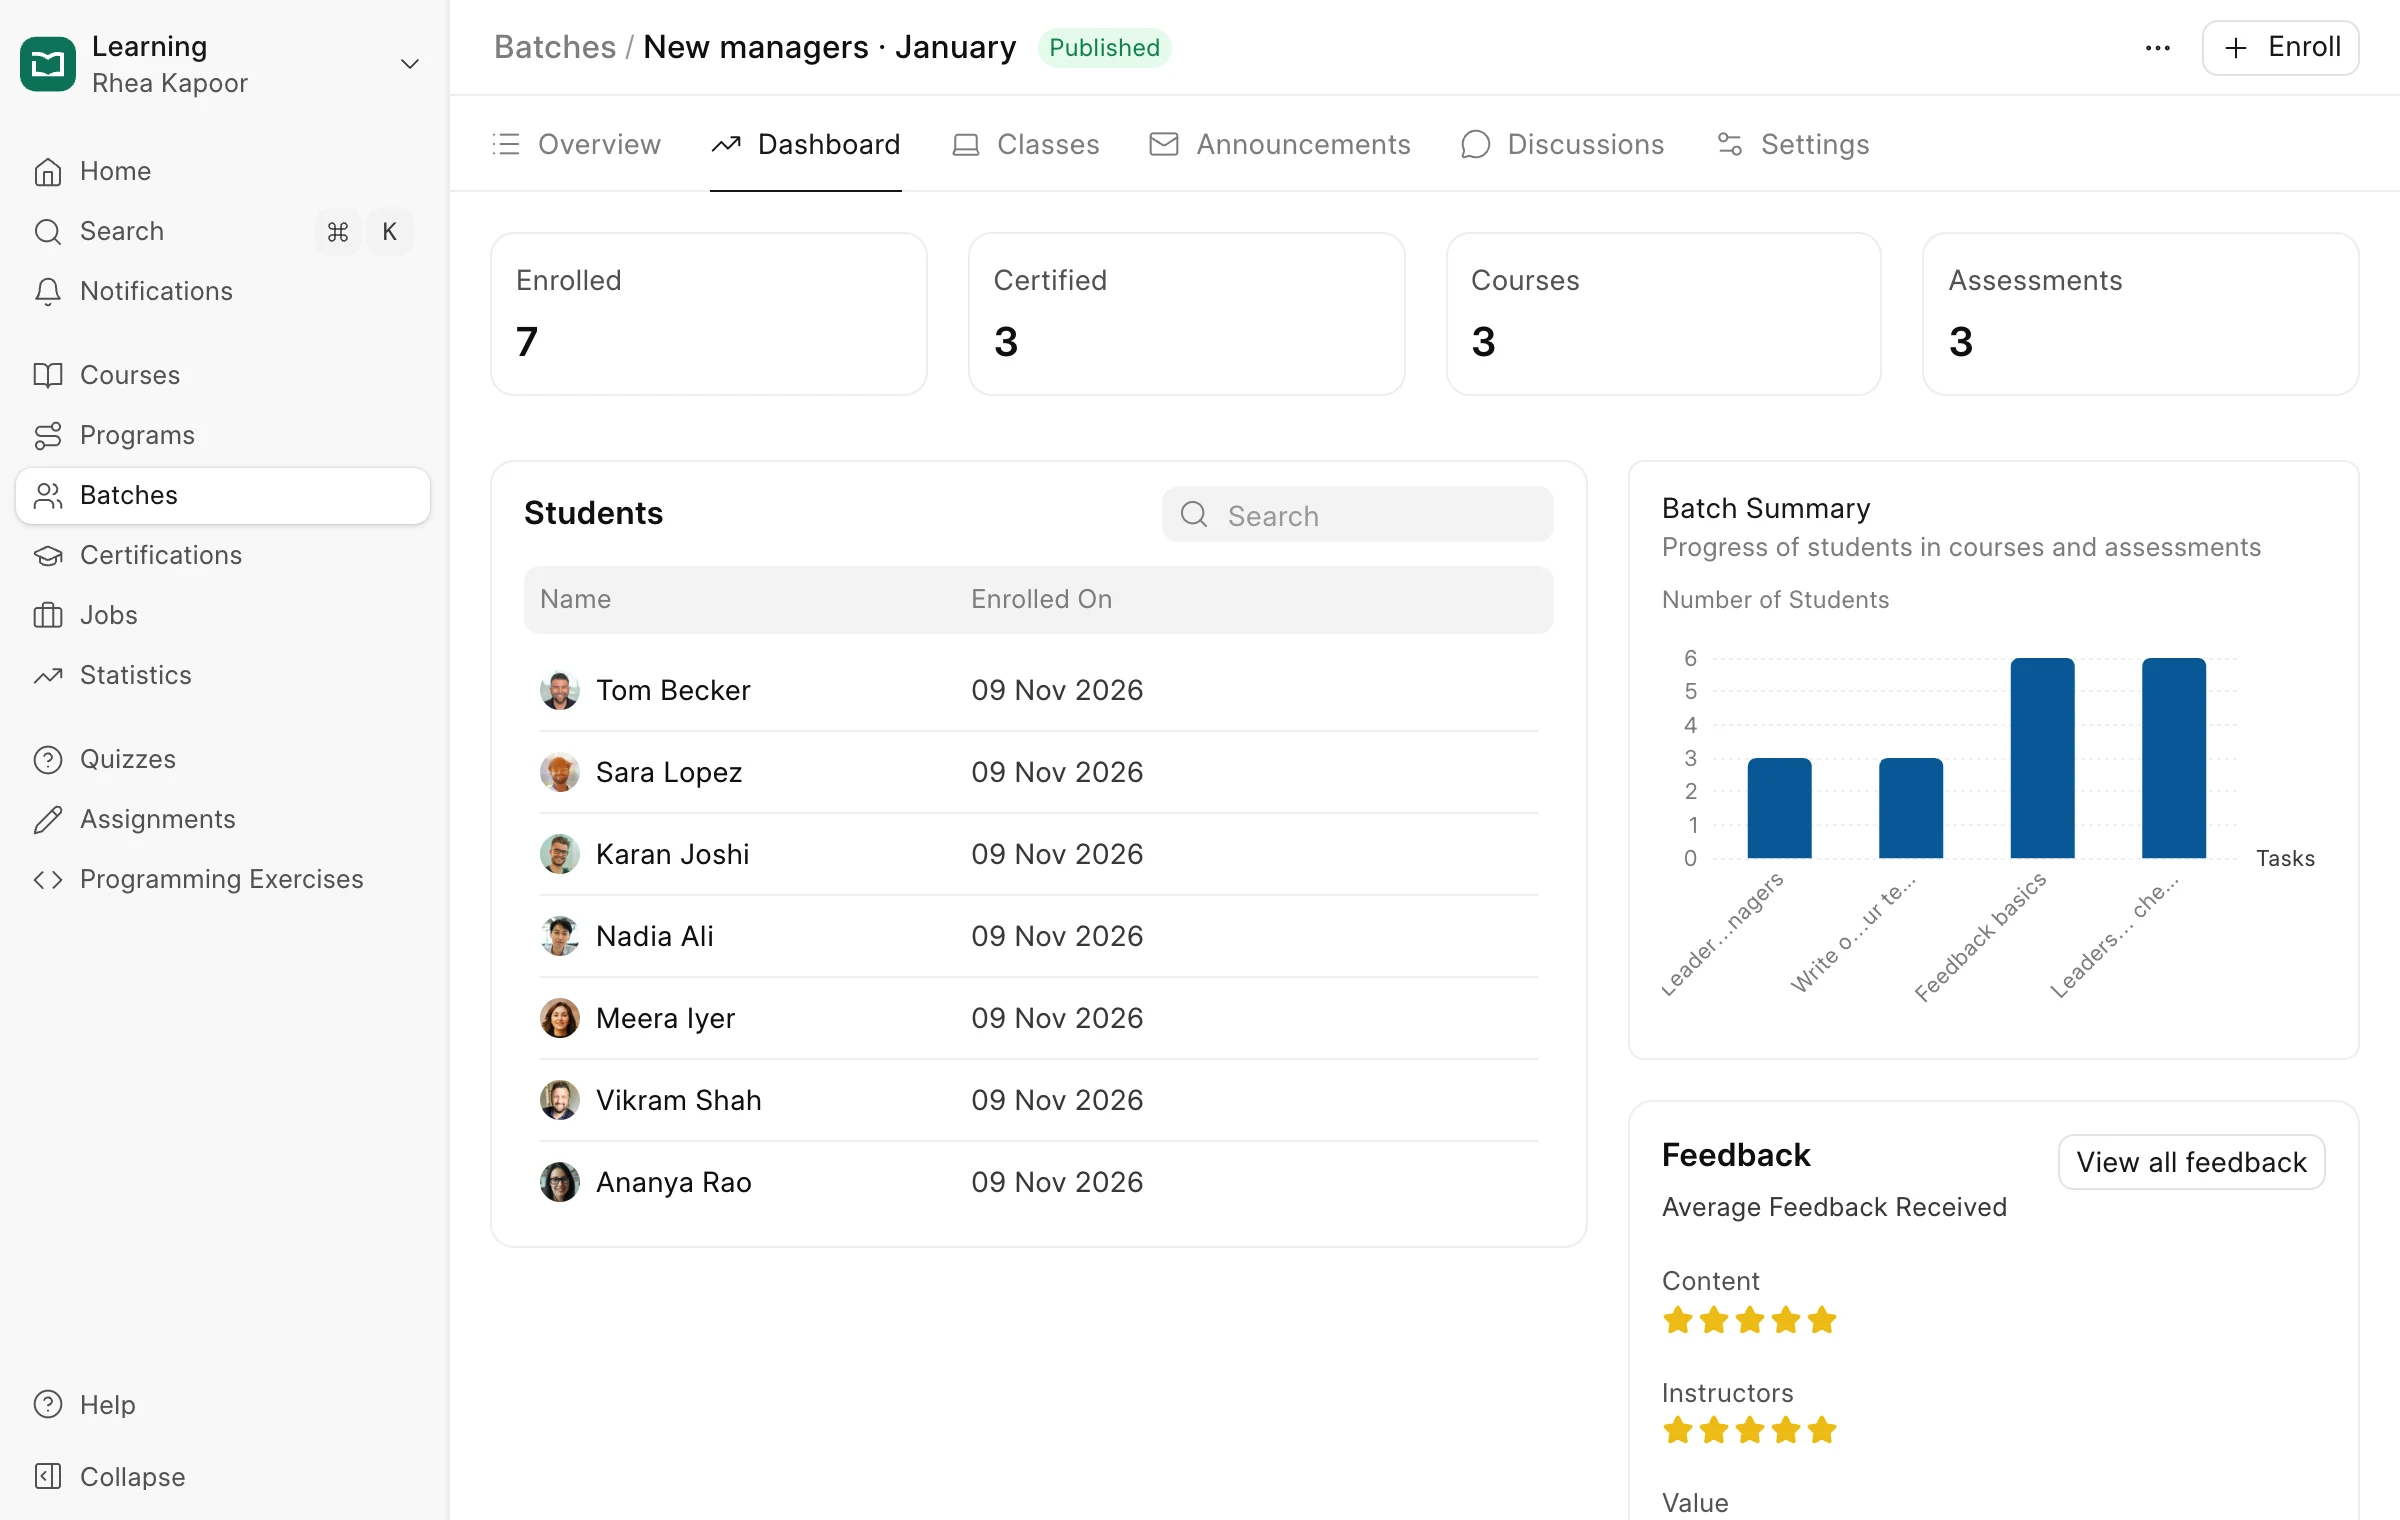
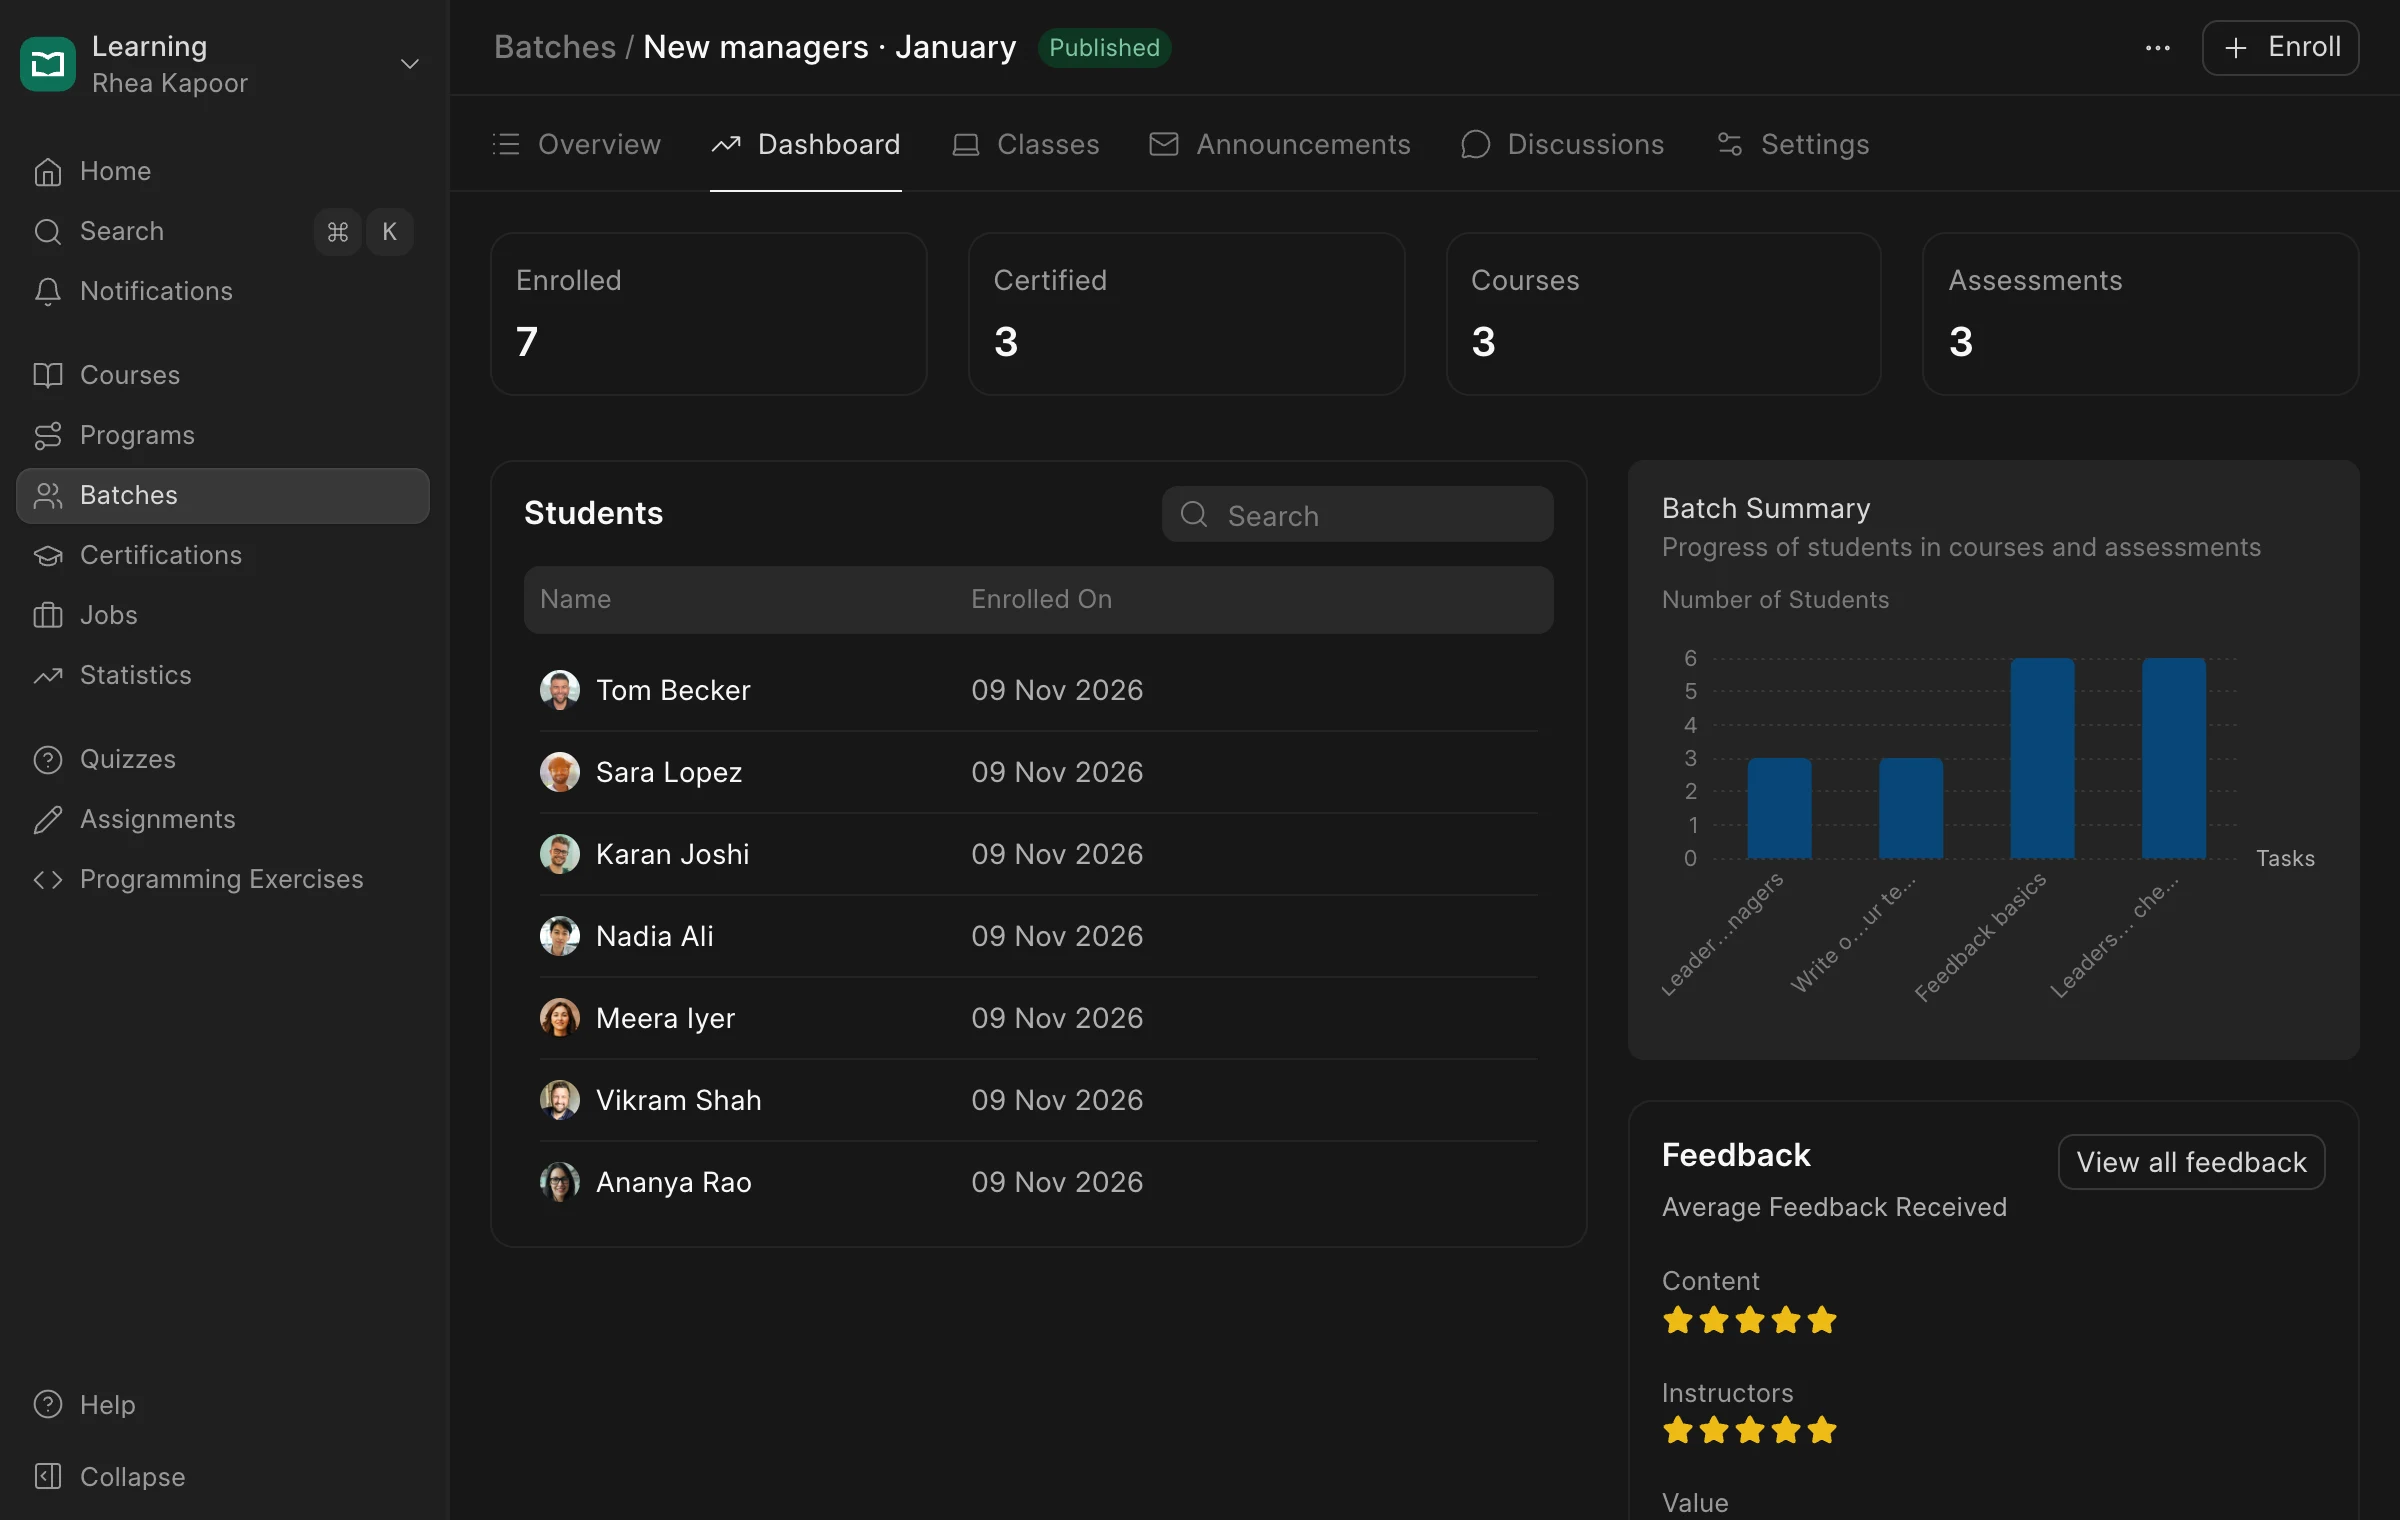
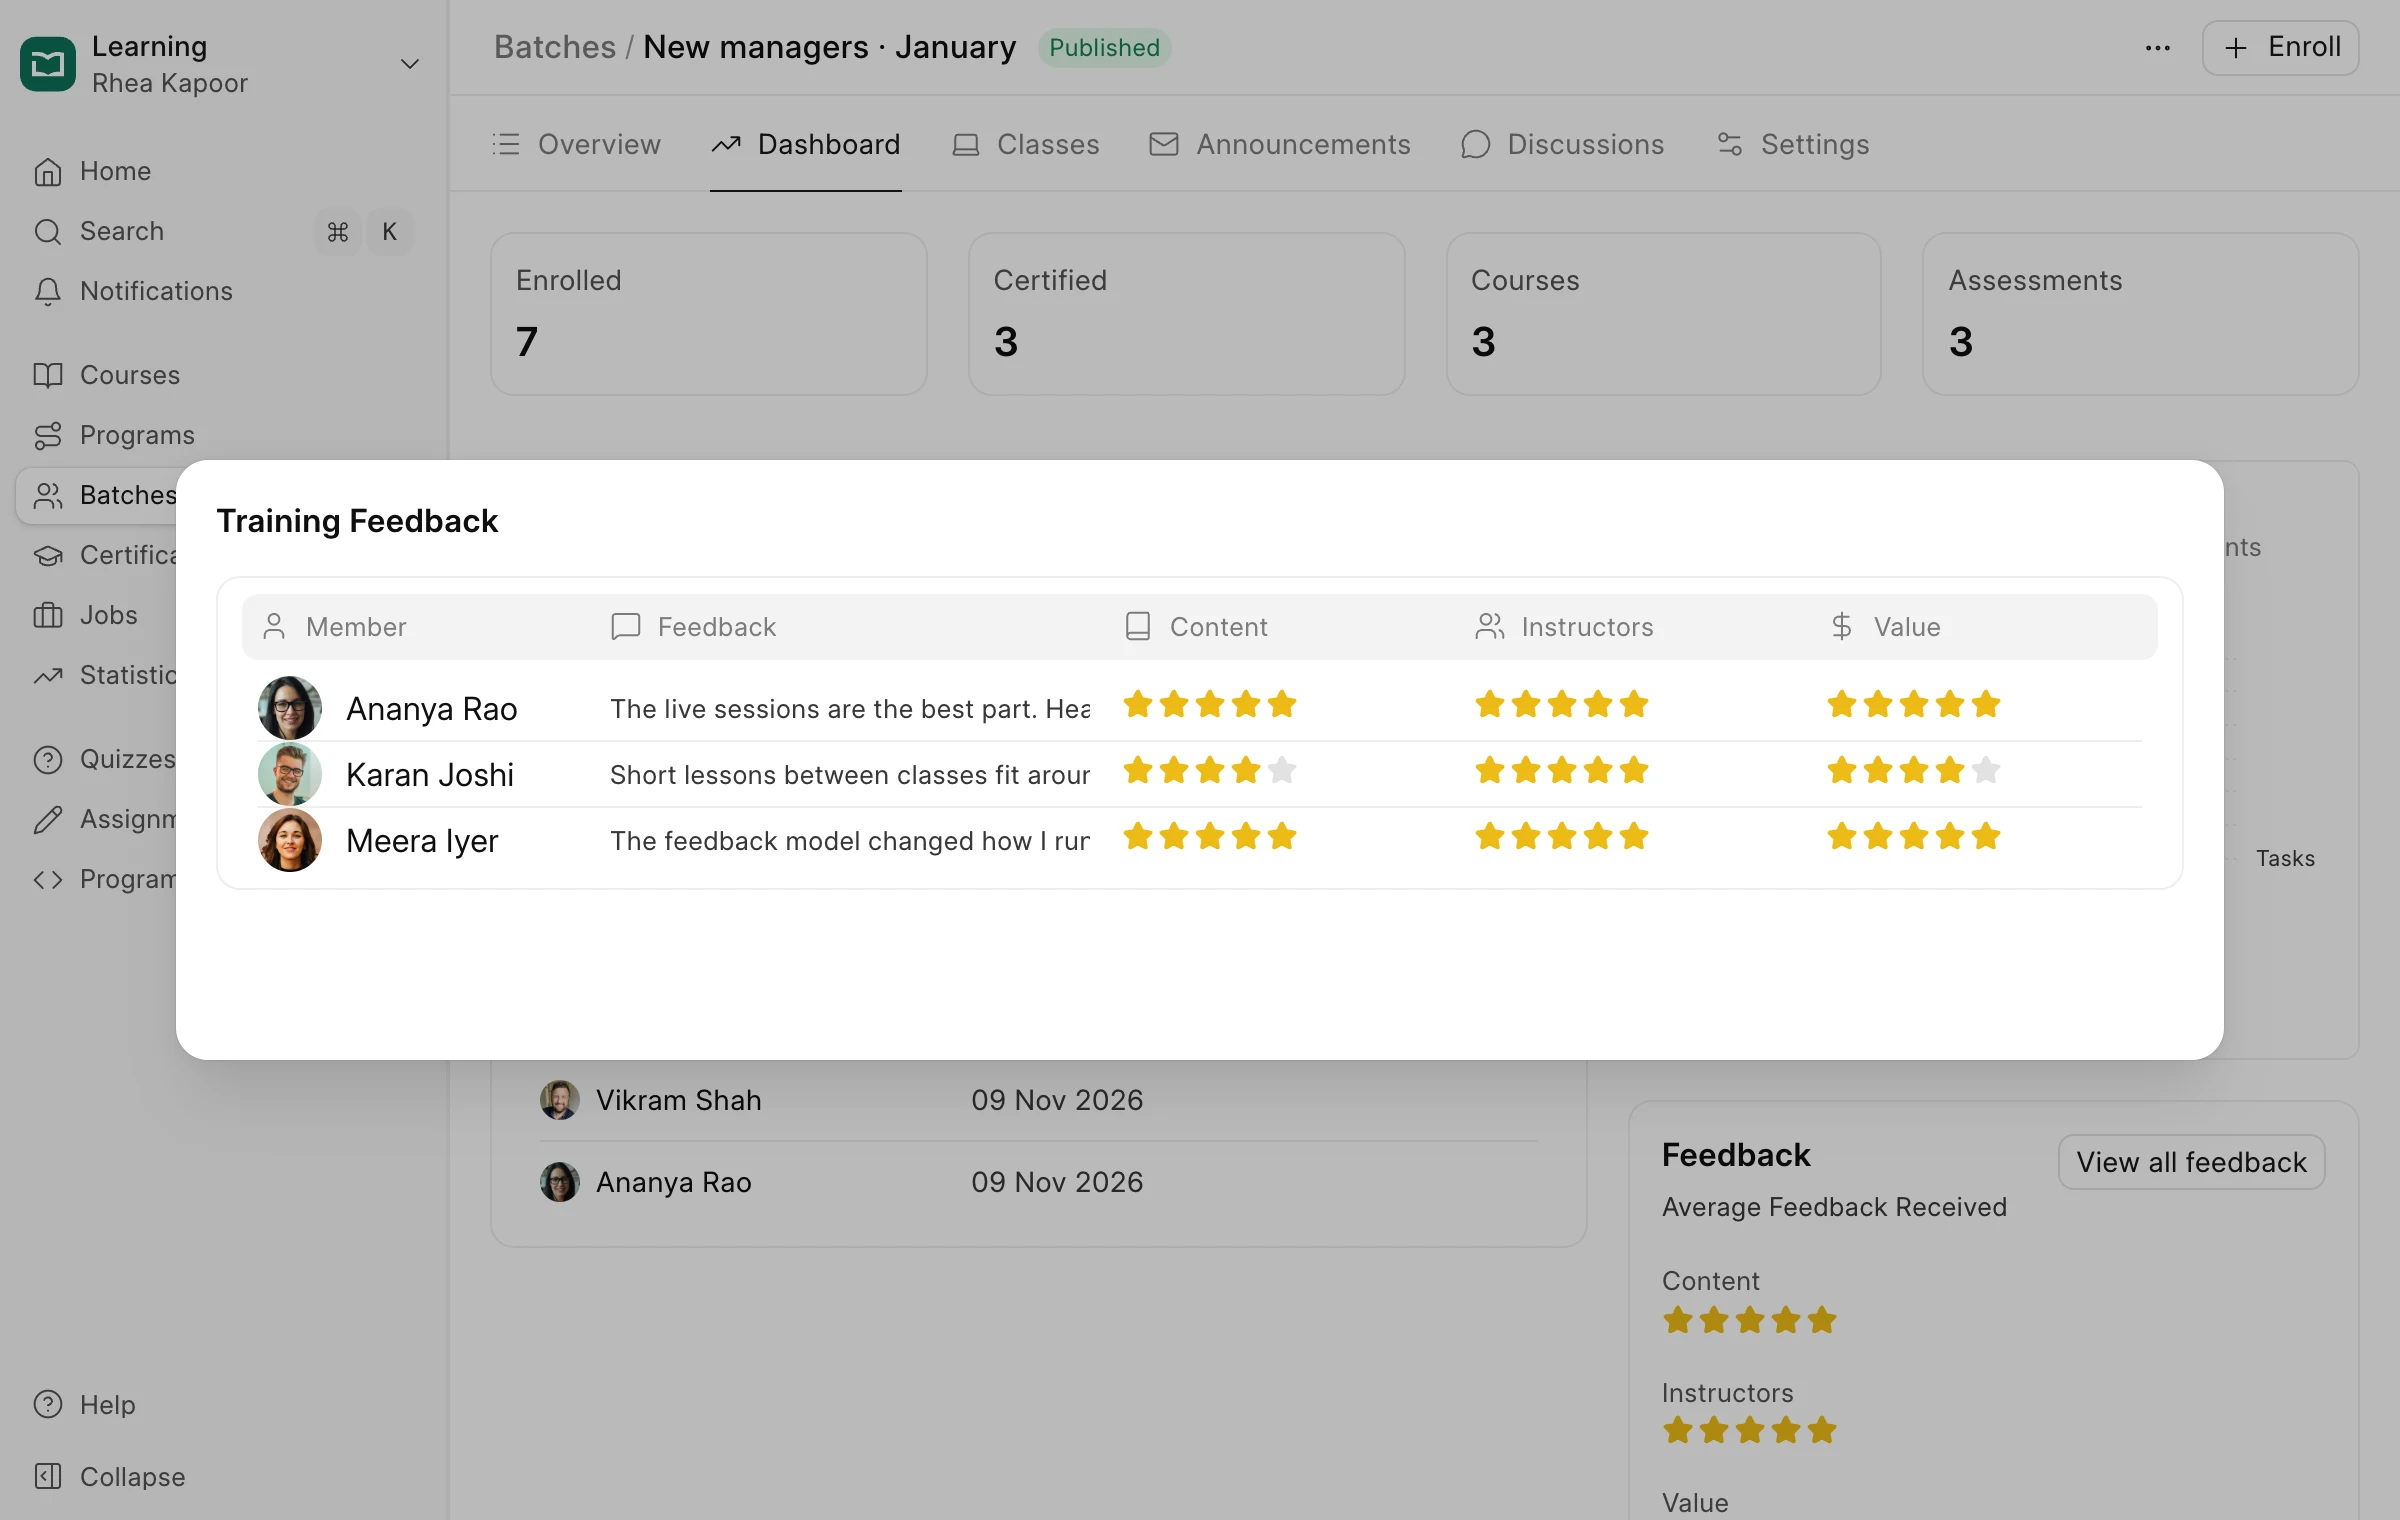
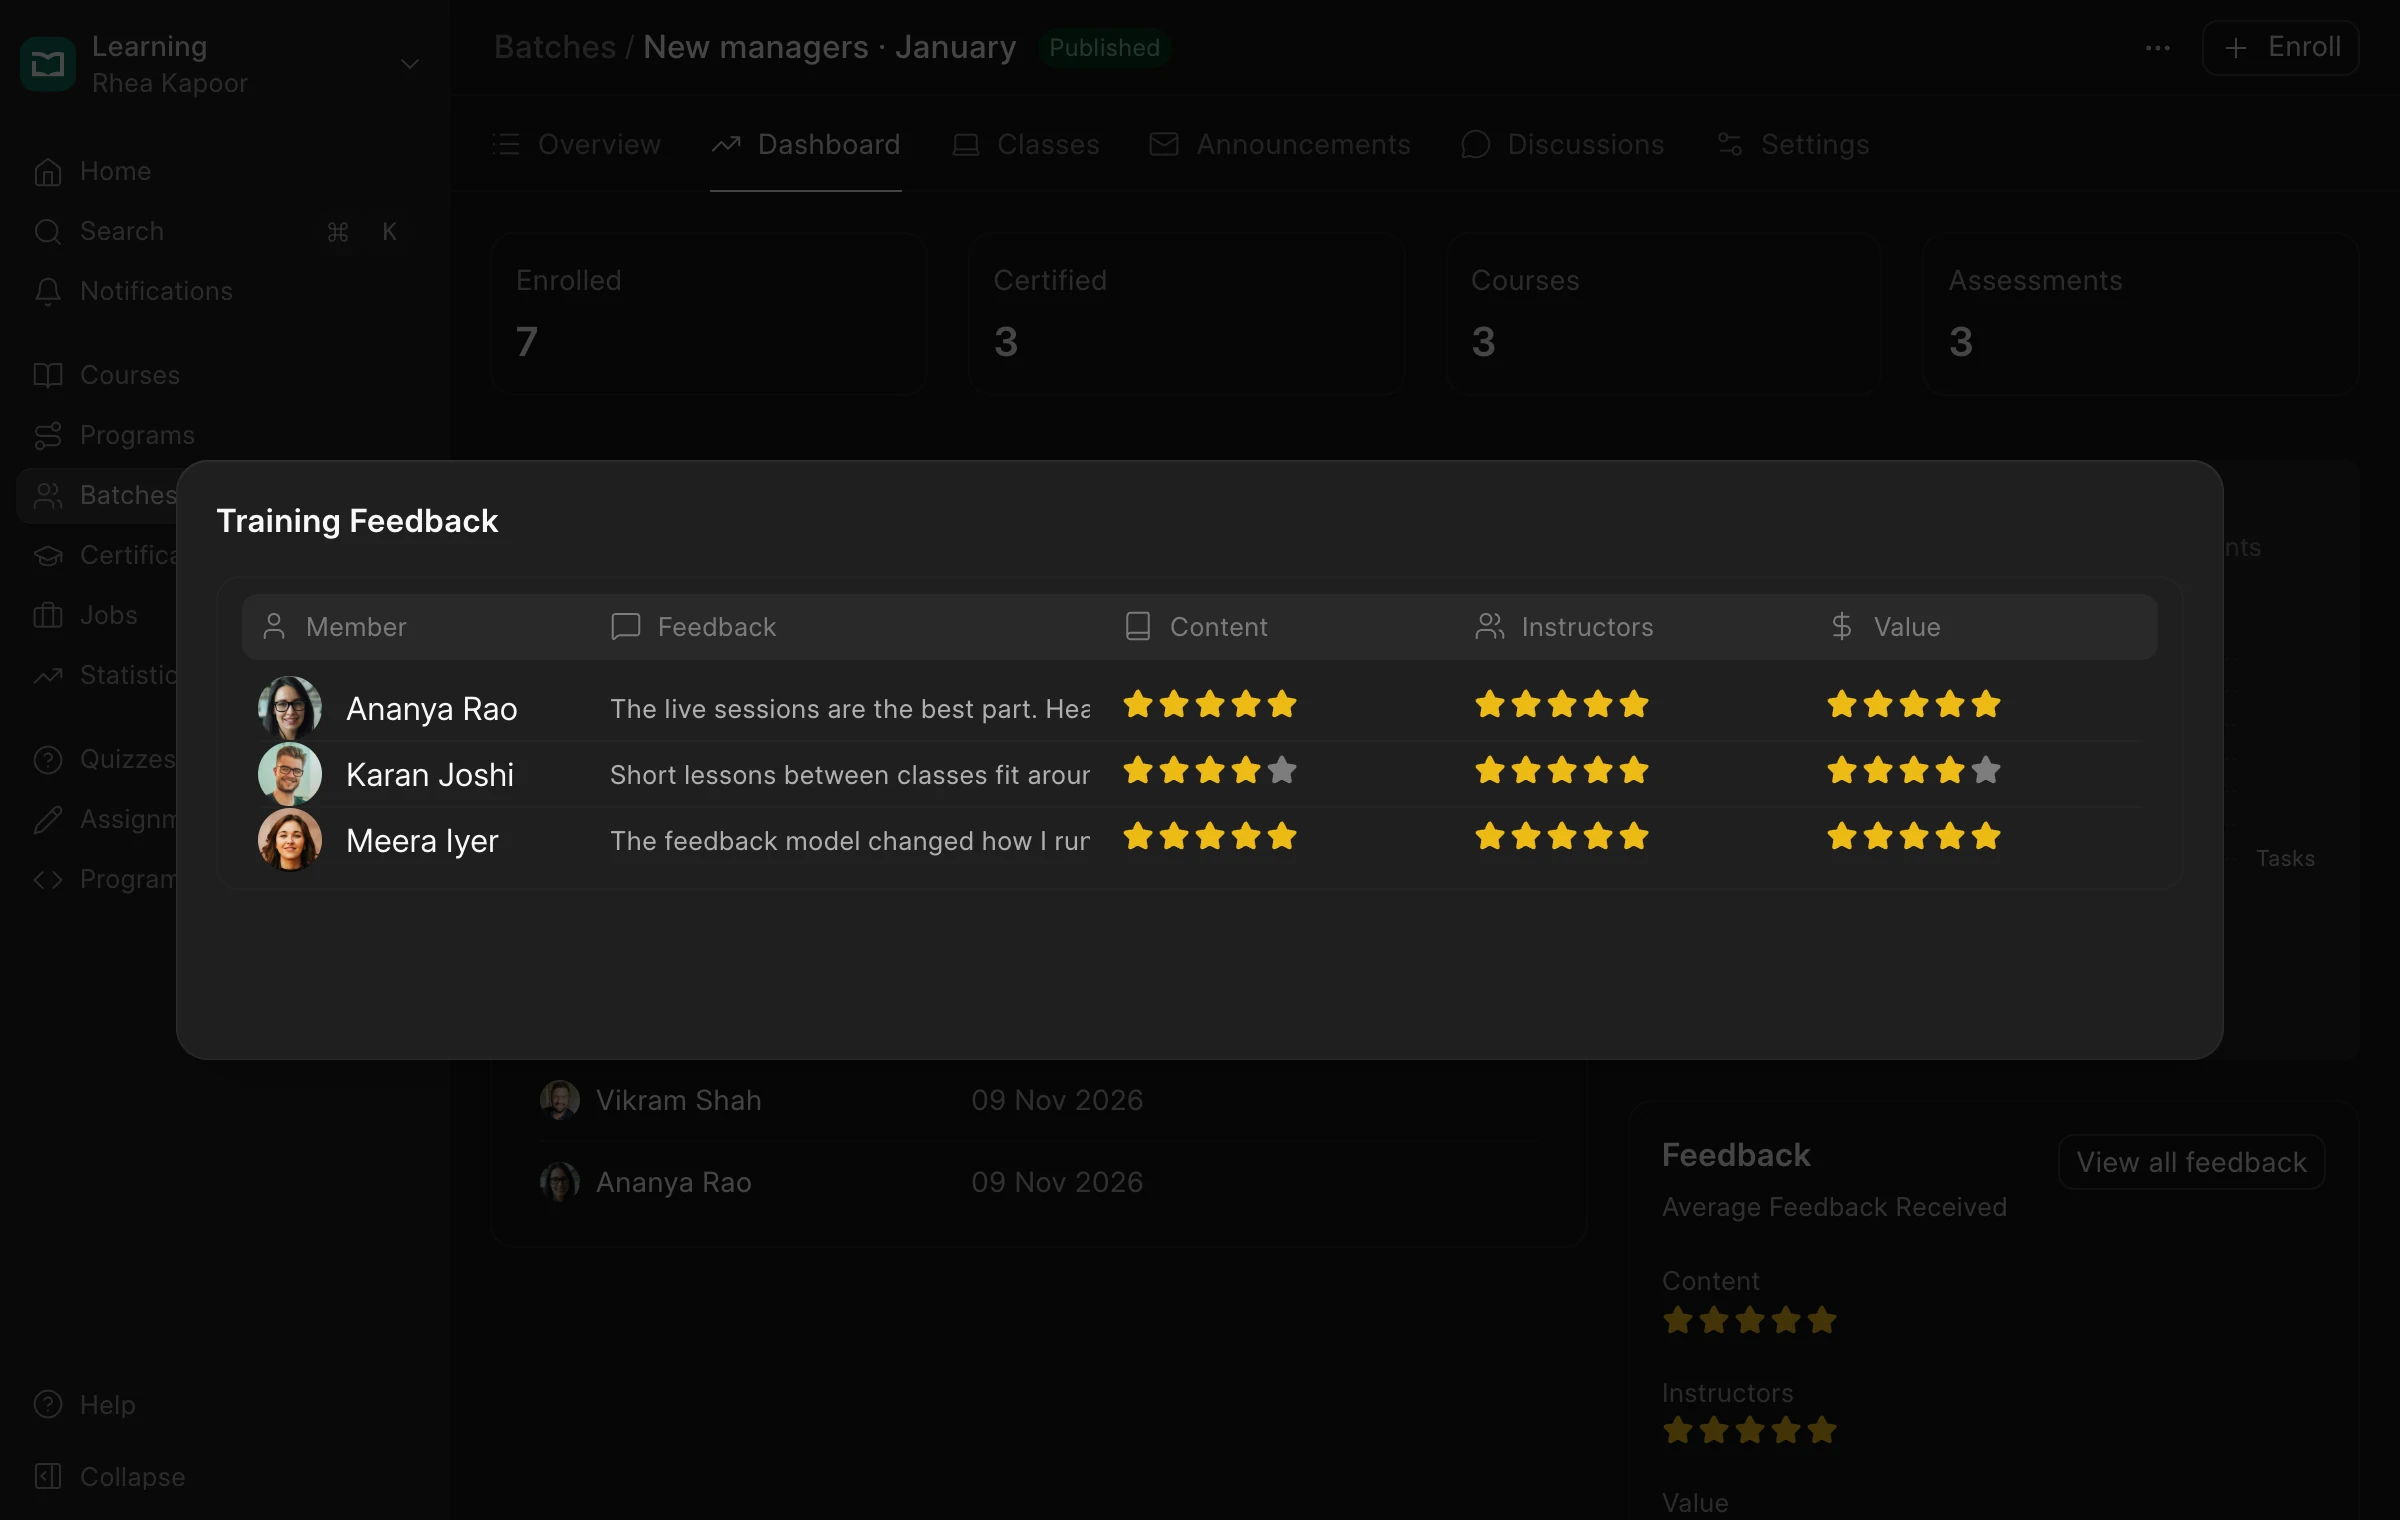
The batch dashboard shows who has finished each course and assessment and who’s certified. Learners also rate the batch on content, instructors and value, and you can read every comment to improve the next one.
Whether videos are actually watched
Video is often the most expensive part of a course to make, so it helps to know it’s being watched.
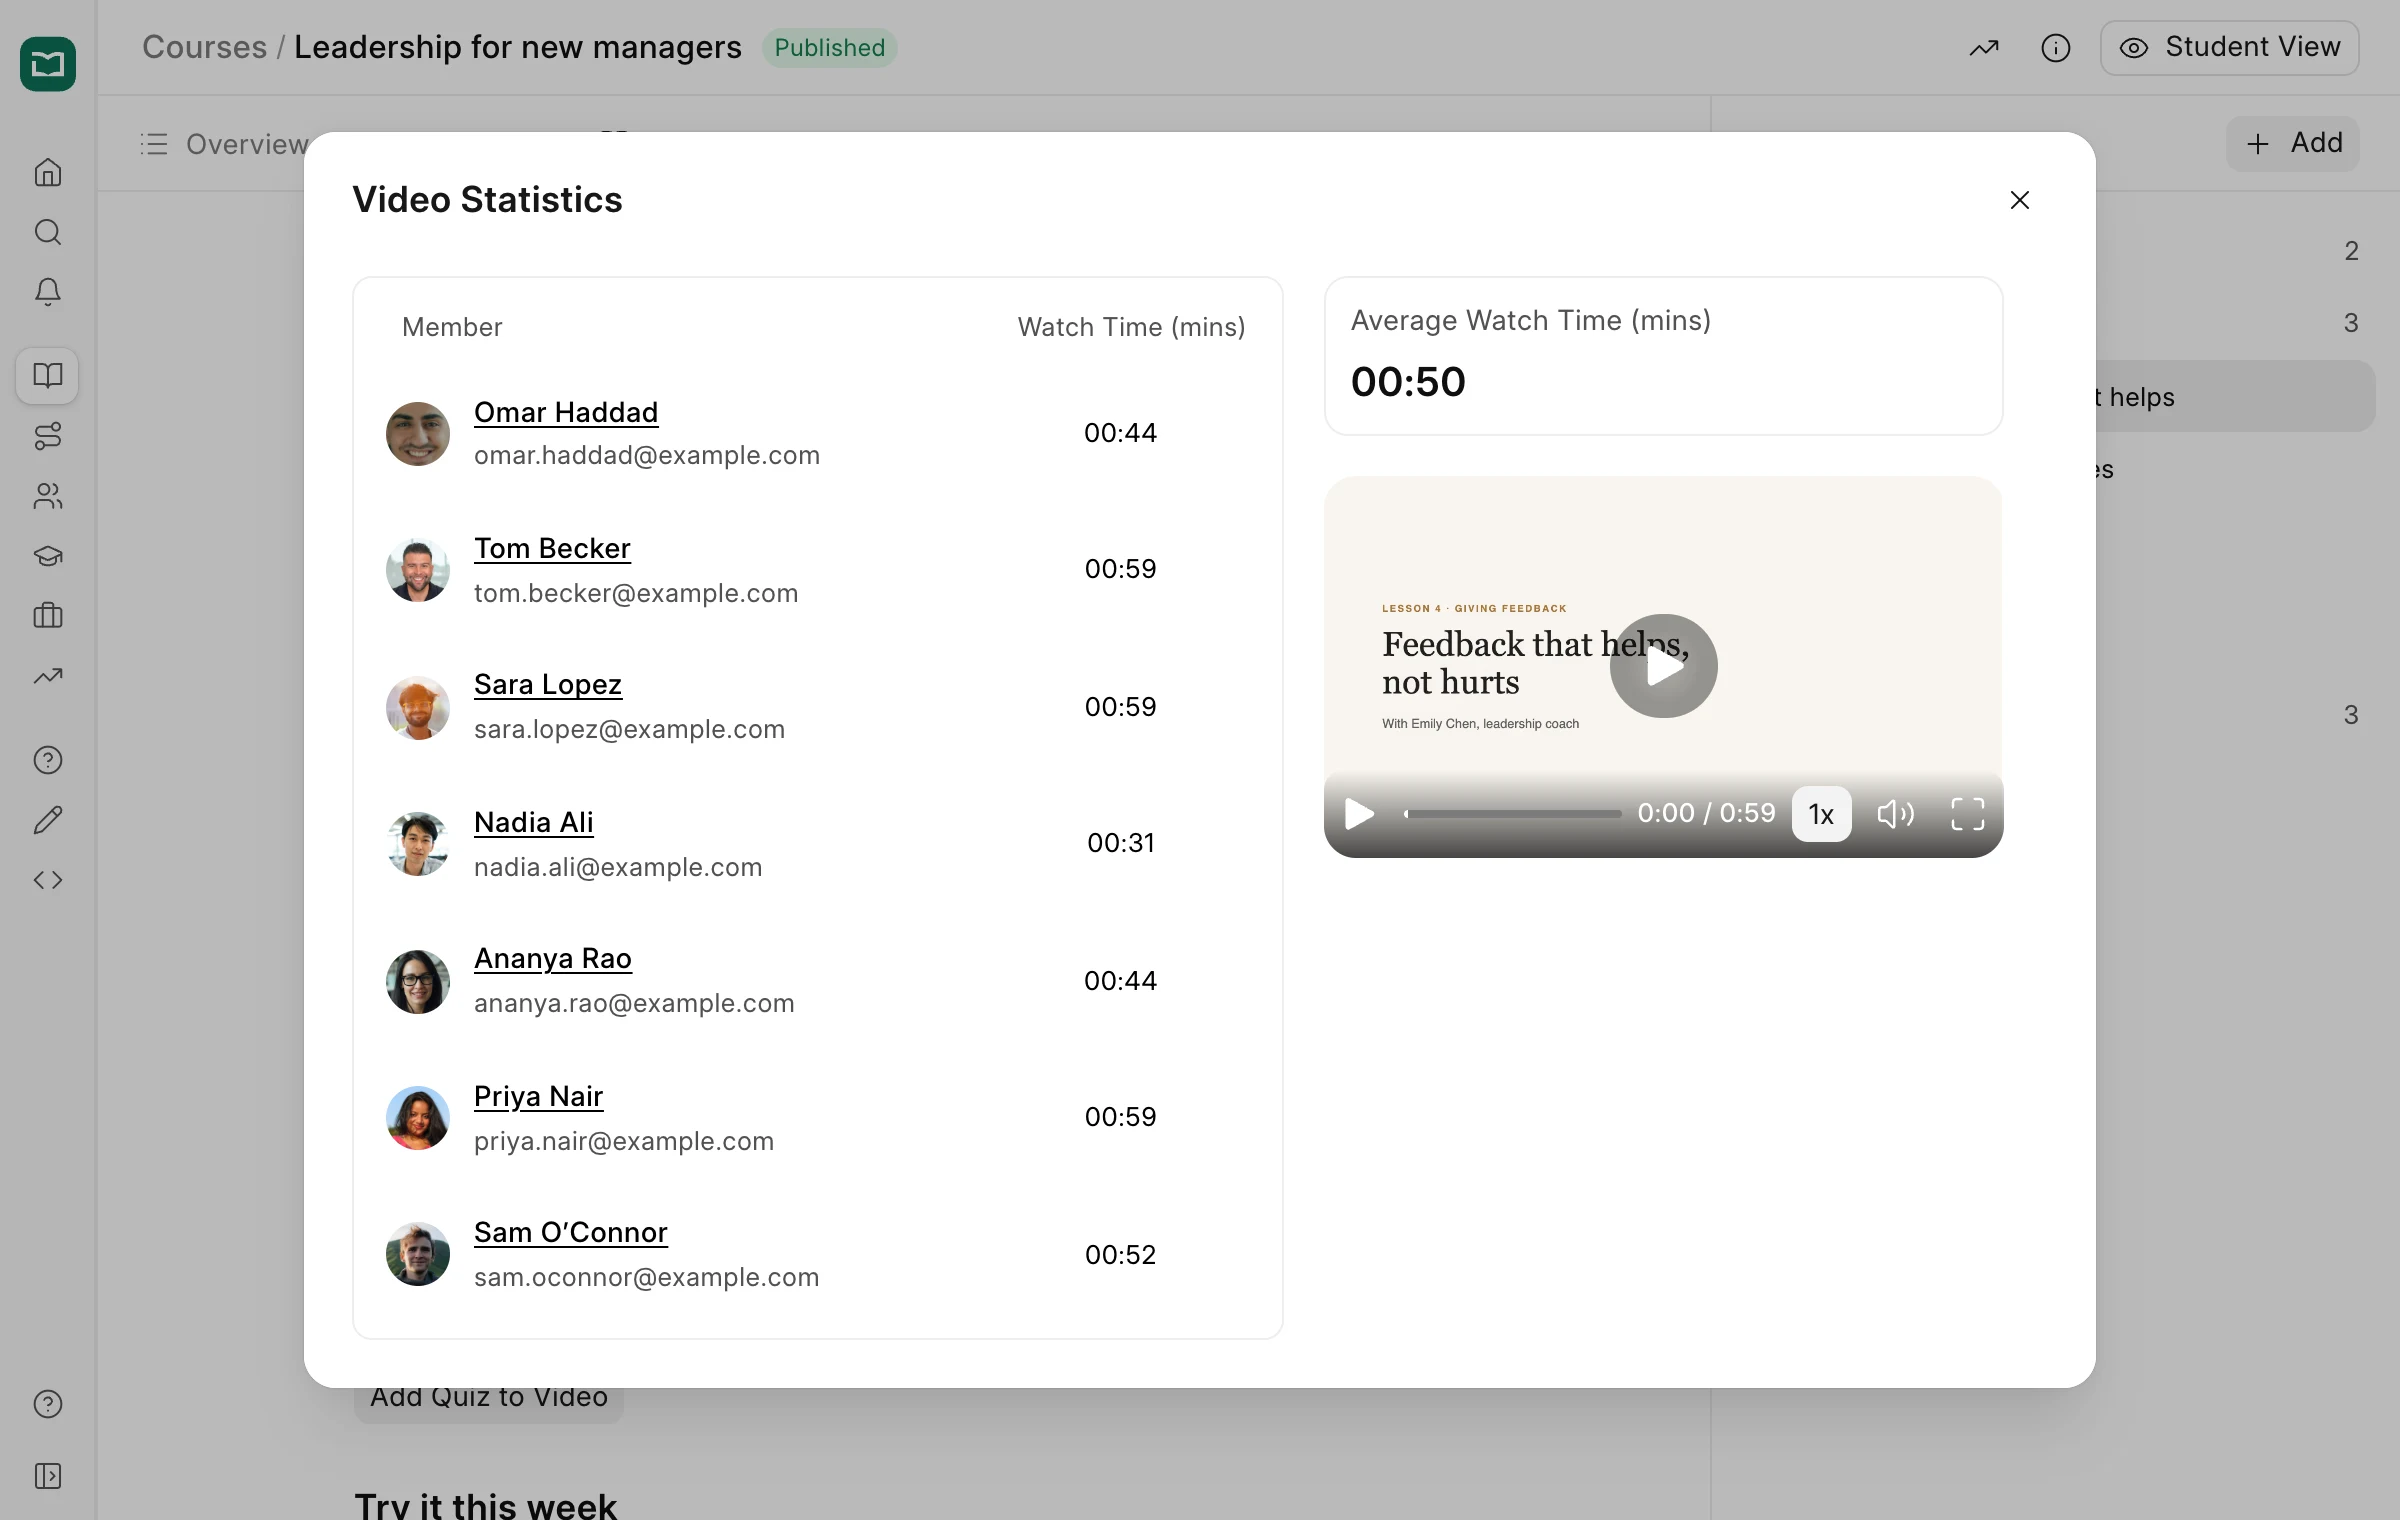
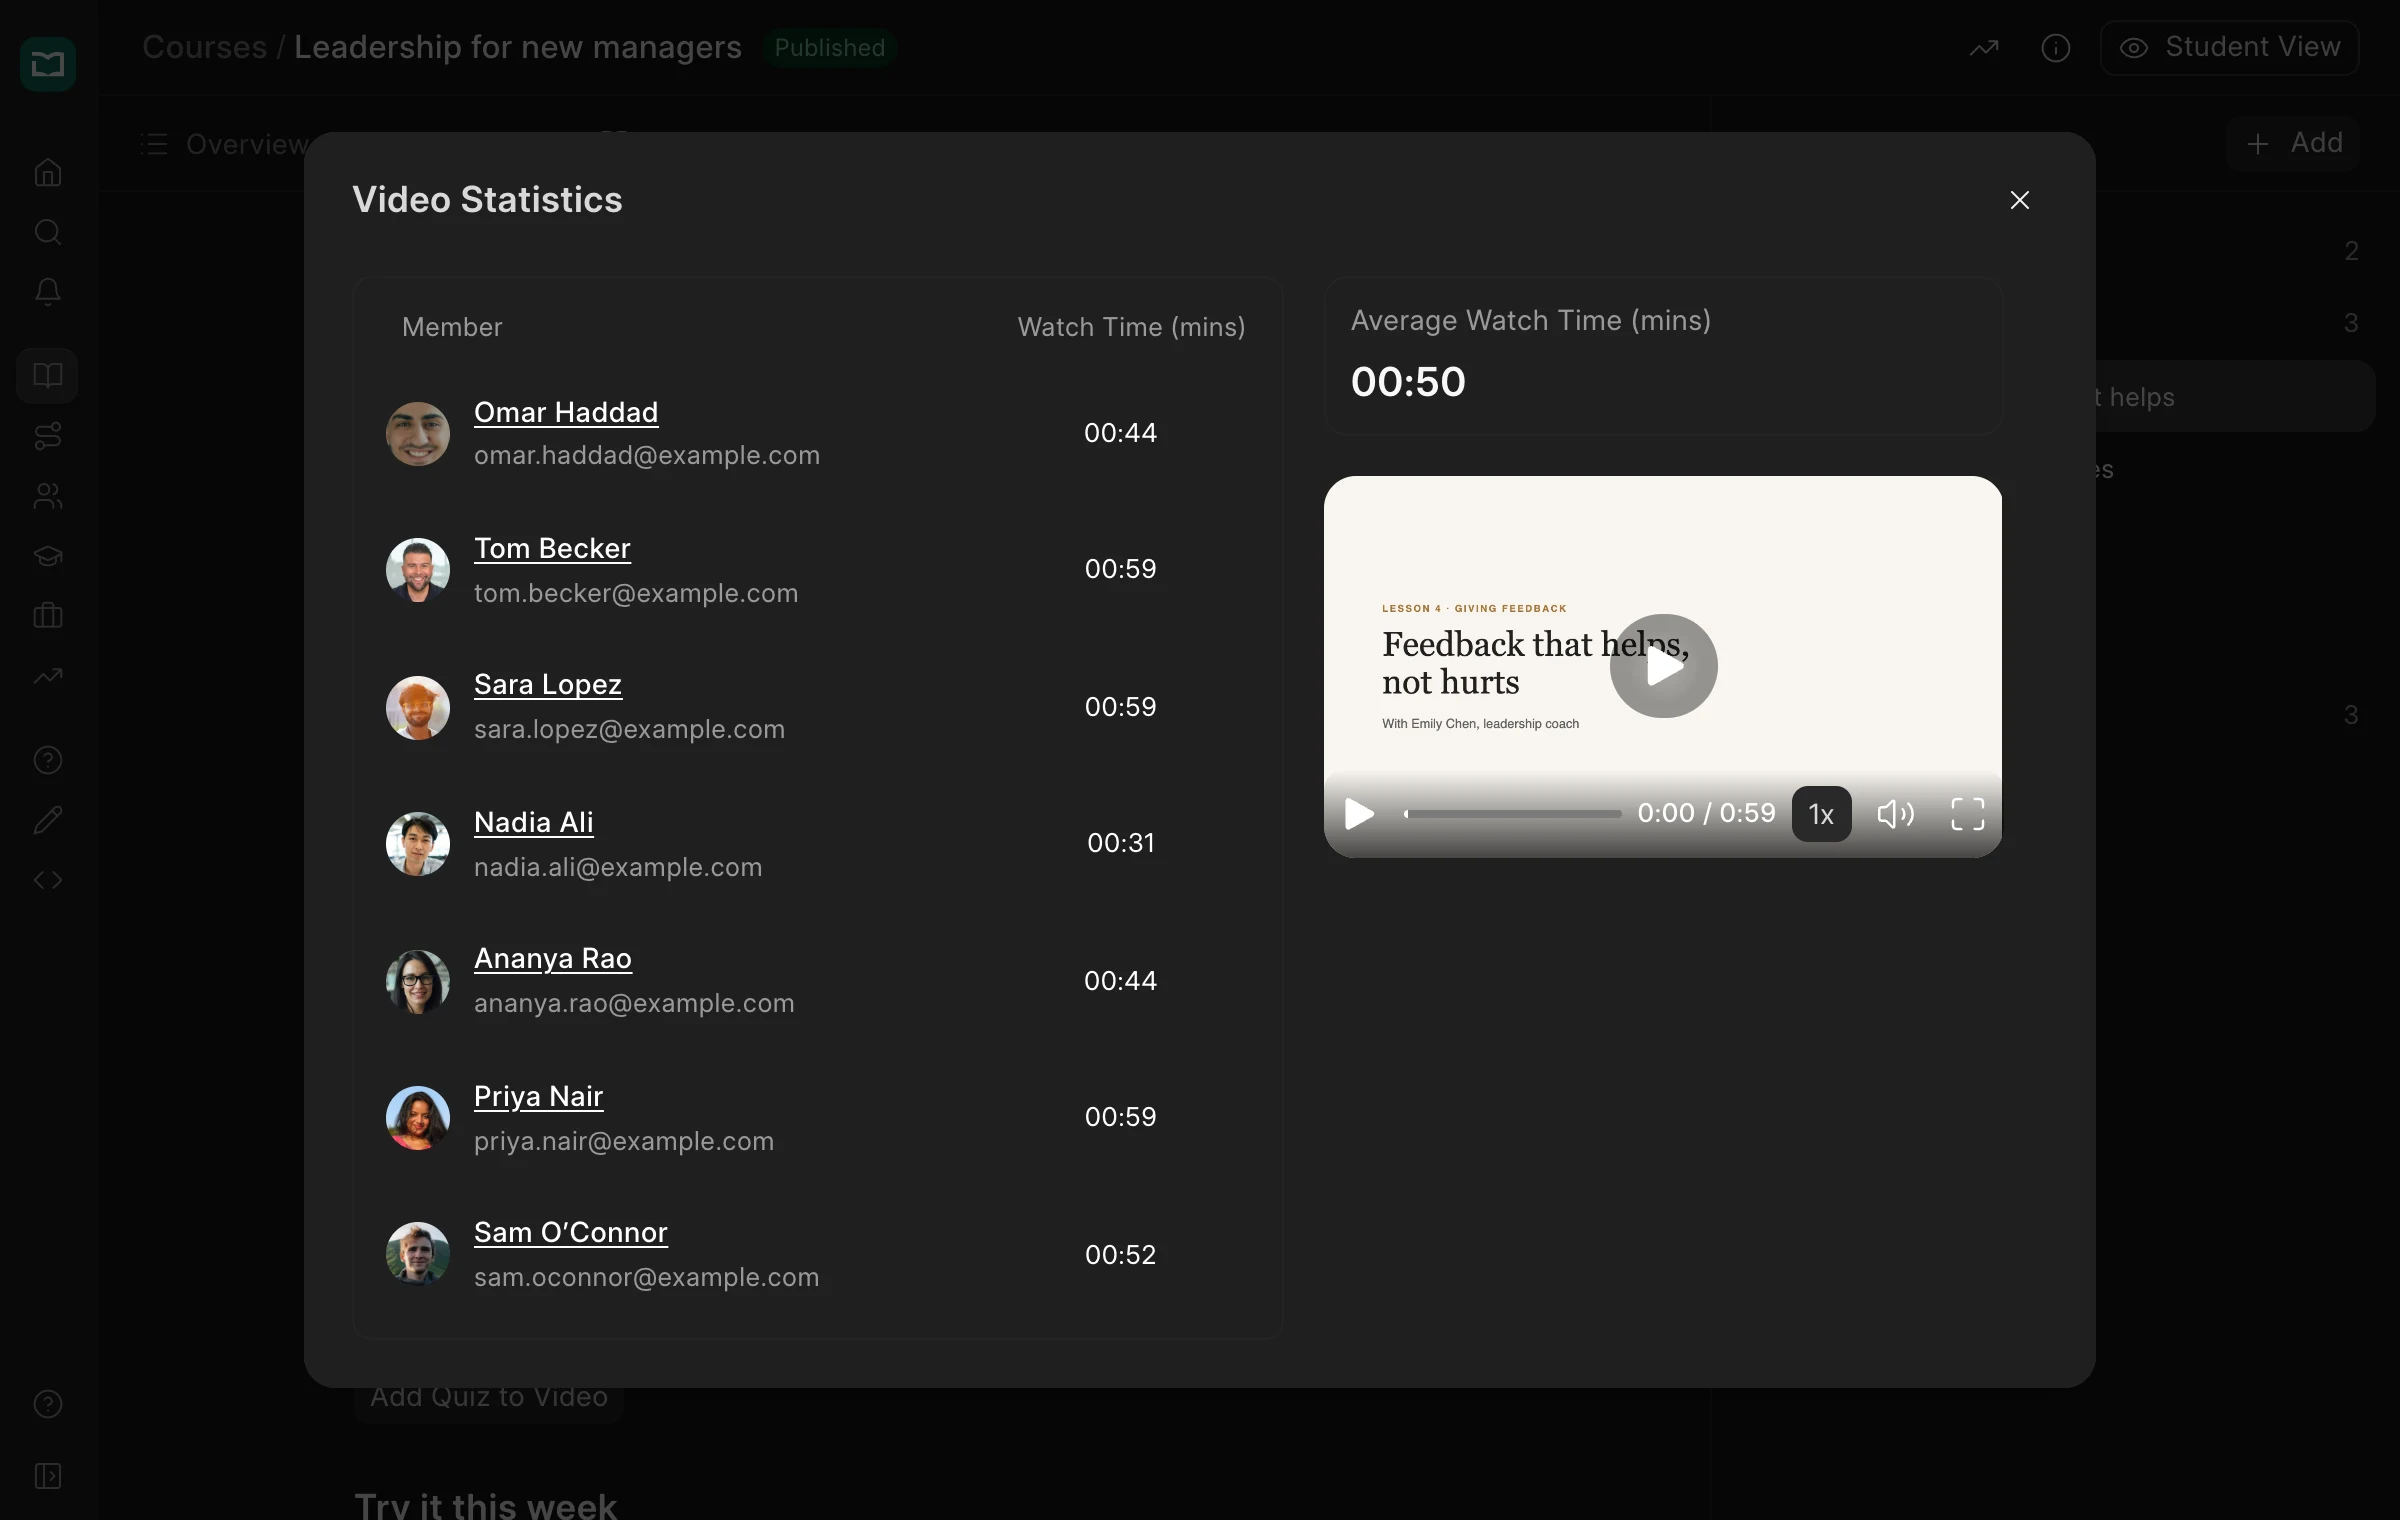
For every video lesson, see how long each learner watched and the average watch time. If most people stop halfway, the video may be too long, and you can split it before the quiz results tell you.
Quiz results in one list
Before a certification exam, you want to know who might need another go.
Every quiz attempt across your courses is in one list with the learner, quiz, score and date. Filter by quiz, course or person to see how a group did, or find everyone below the pass mark.
previous feature
Community & Jobs
next feature
Assignment Rules