Frappe
Products
Helpdesk
Insights and Reporting
Frappe
Products
Insights
features
Insights and Reporting
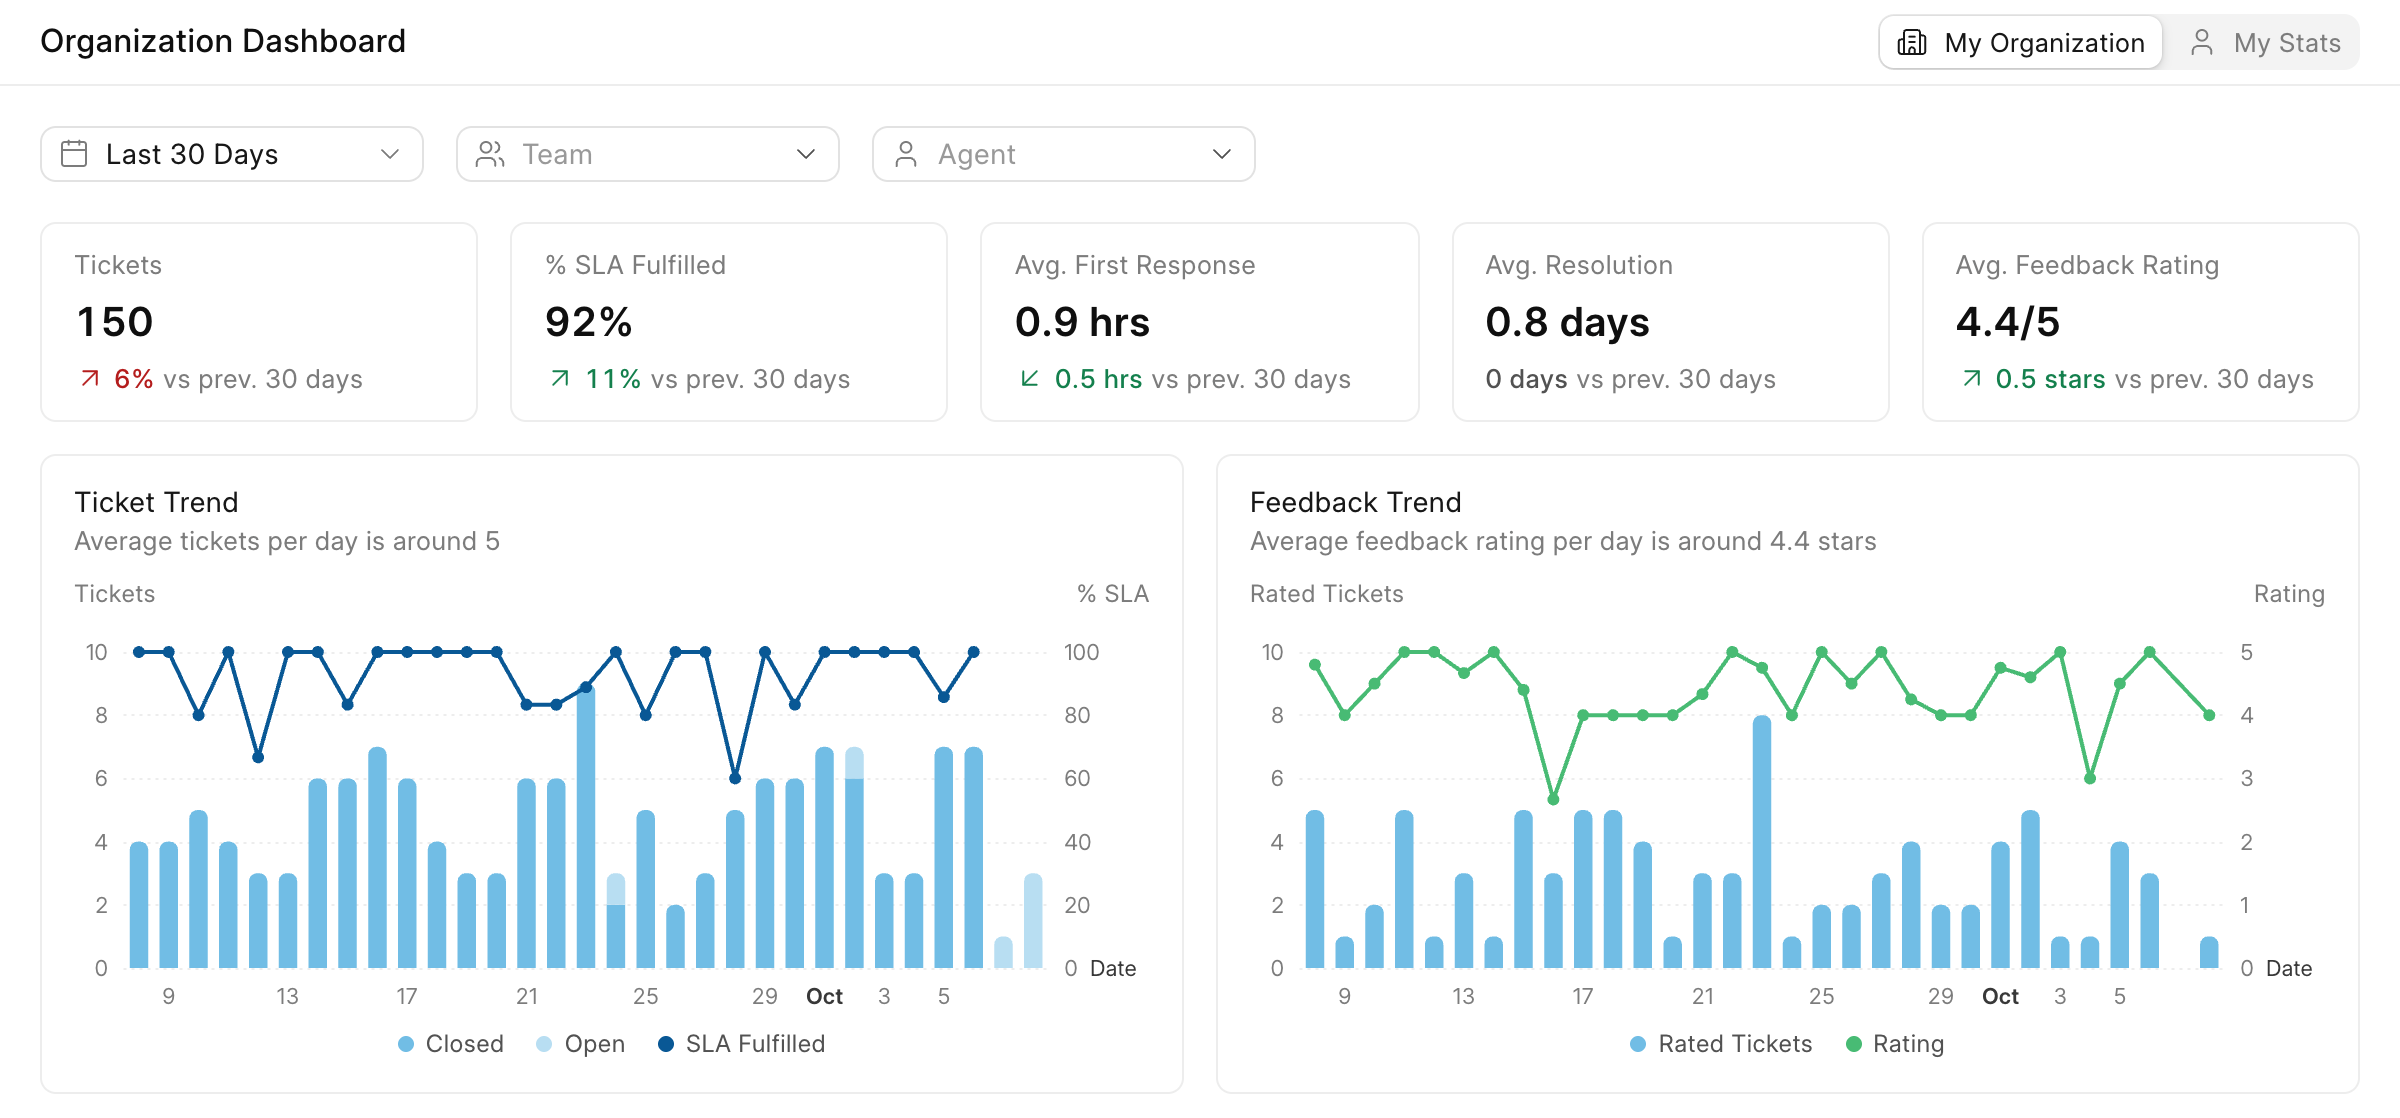
The dashboard in Frappe Helpdesk shows how your support is going: how many tickets came in, how quickly your team replied, how many SLAs were met and how customers rated their support.
Every number is compared with the previous period, so you can tell right away if things are getting better or worse.
1.
See how your support is doing
2.
See where tickets come from
3.
Find the issues that keep coming up
4.
A Home page for every agent
5.
Look back at any ticket
6.
Export your data or build your own reports
See how your support is doing
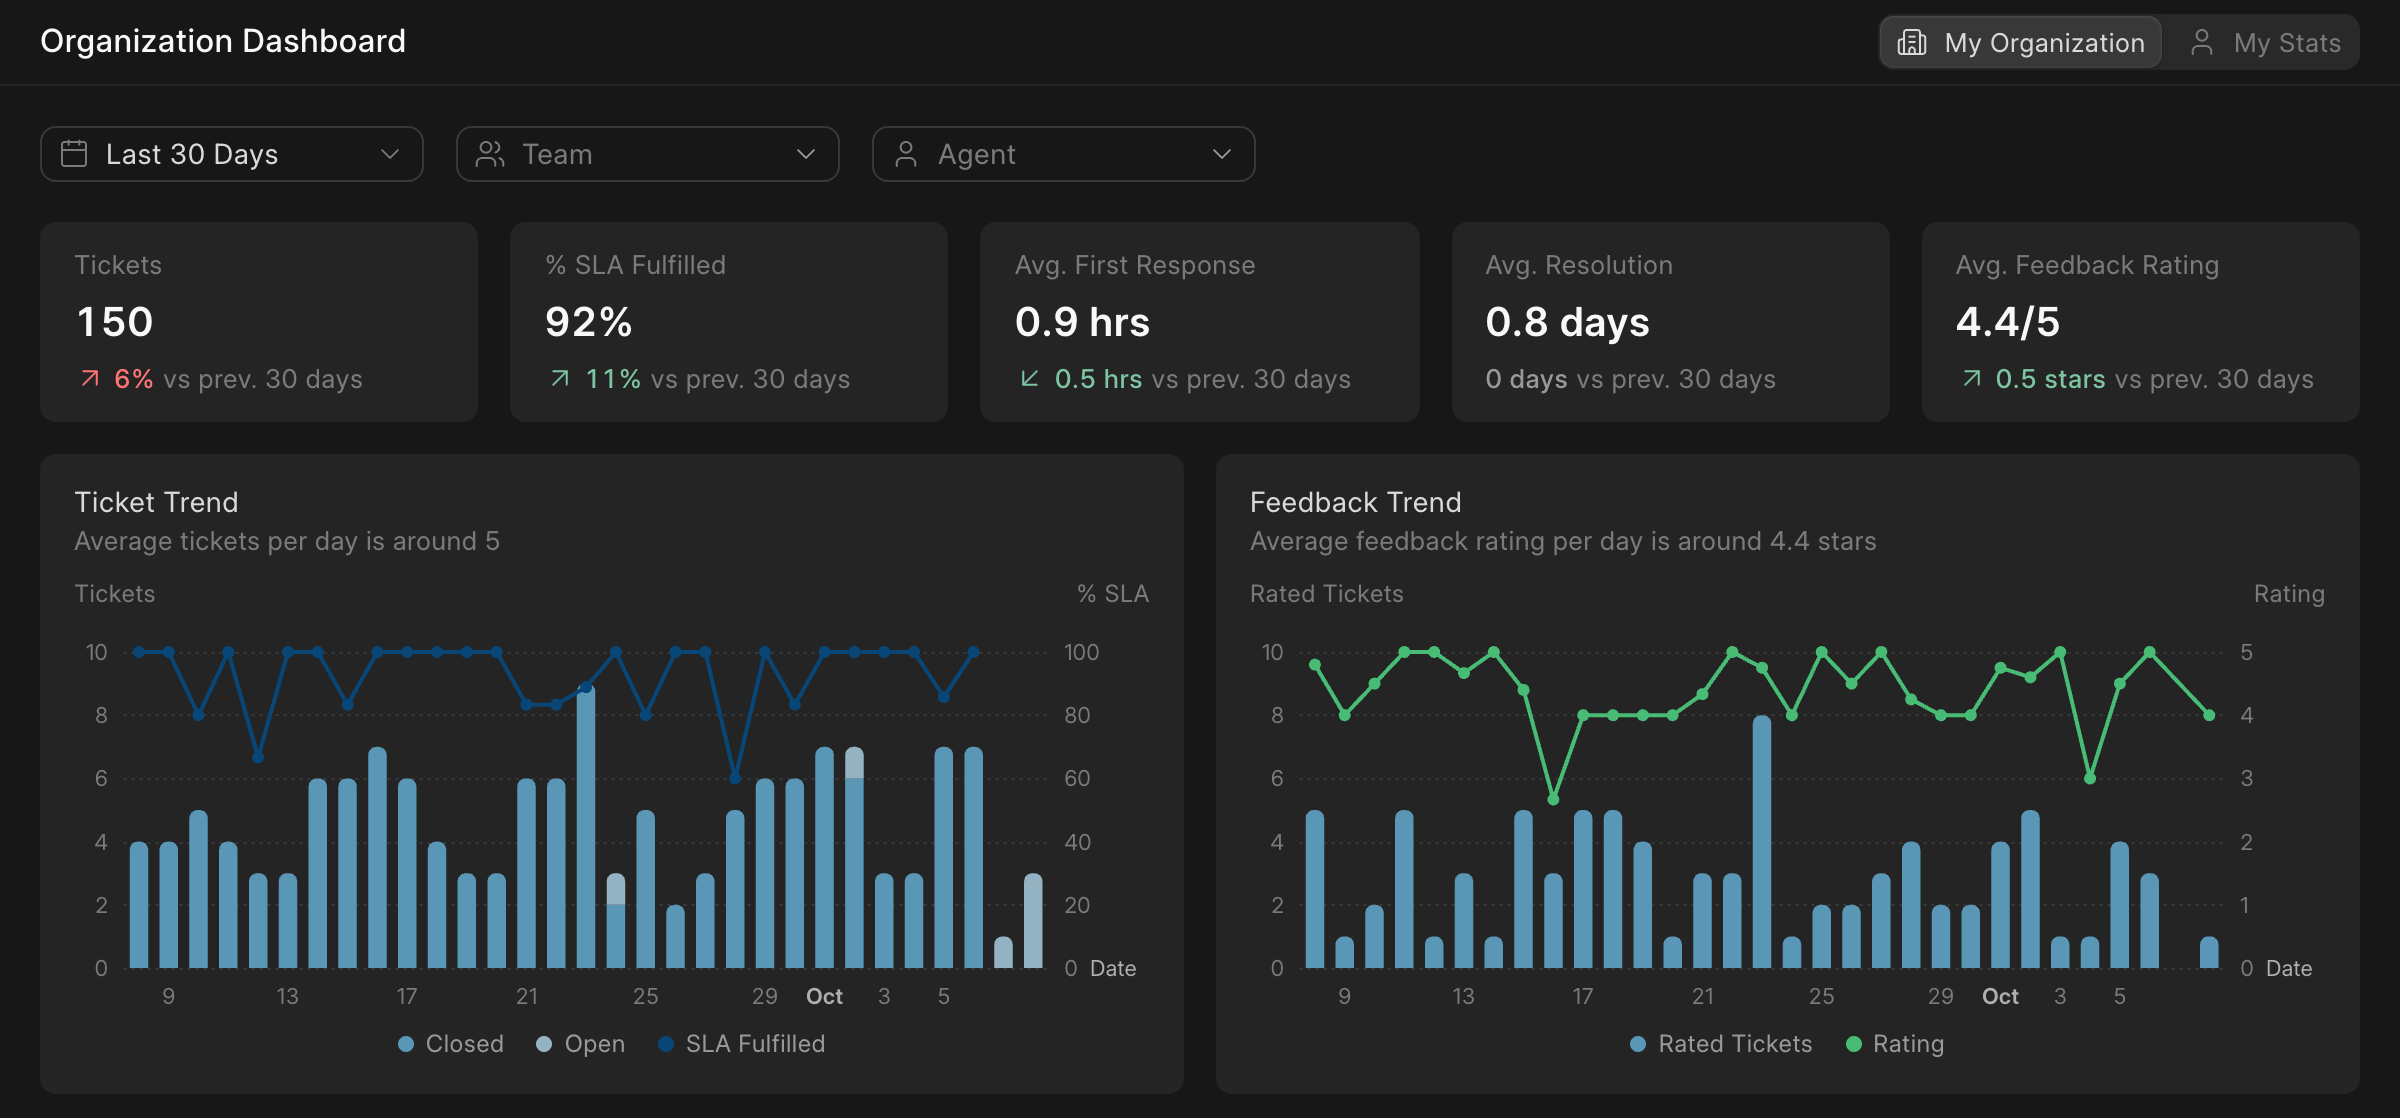
The dashboard starts with five numbers: tickets, SLAs fulfilled, average first response, average resolution and average feedback rating. Each one shows how much it changed since the previous period.
Below them, the ticket trend shows tickets per day and how many met their SLA, and the feedback trend shows how customers rated their tickets each day. You can pick any date range and look at one team or one agent.
See where tickets come from
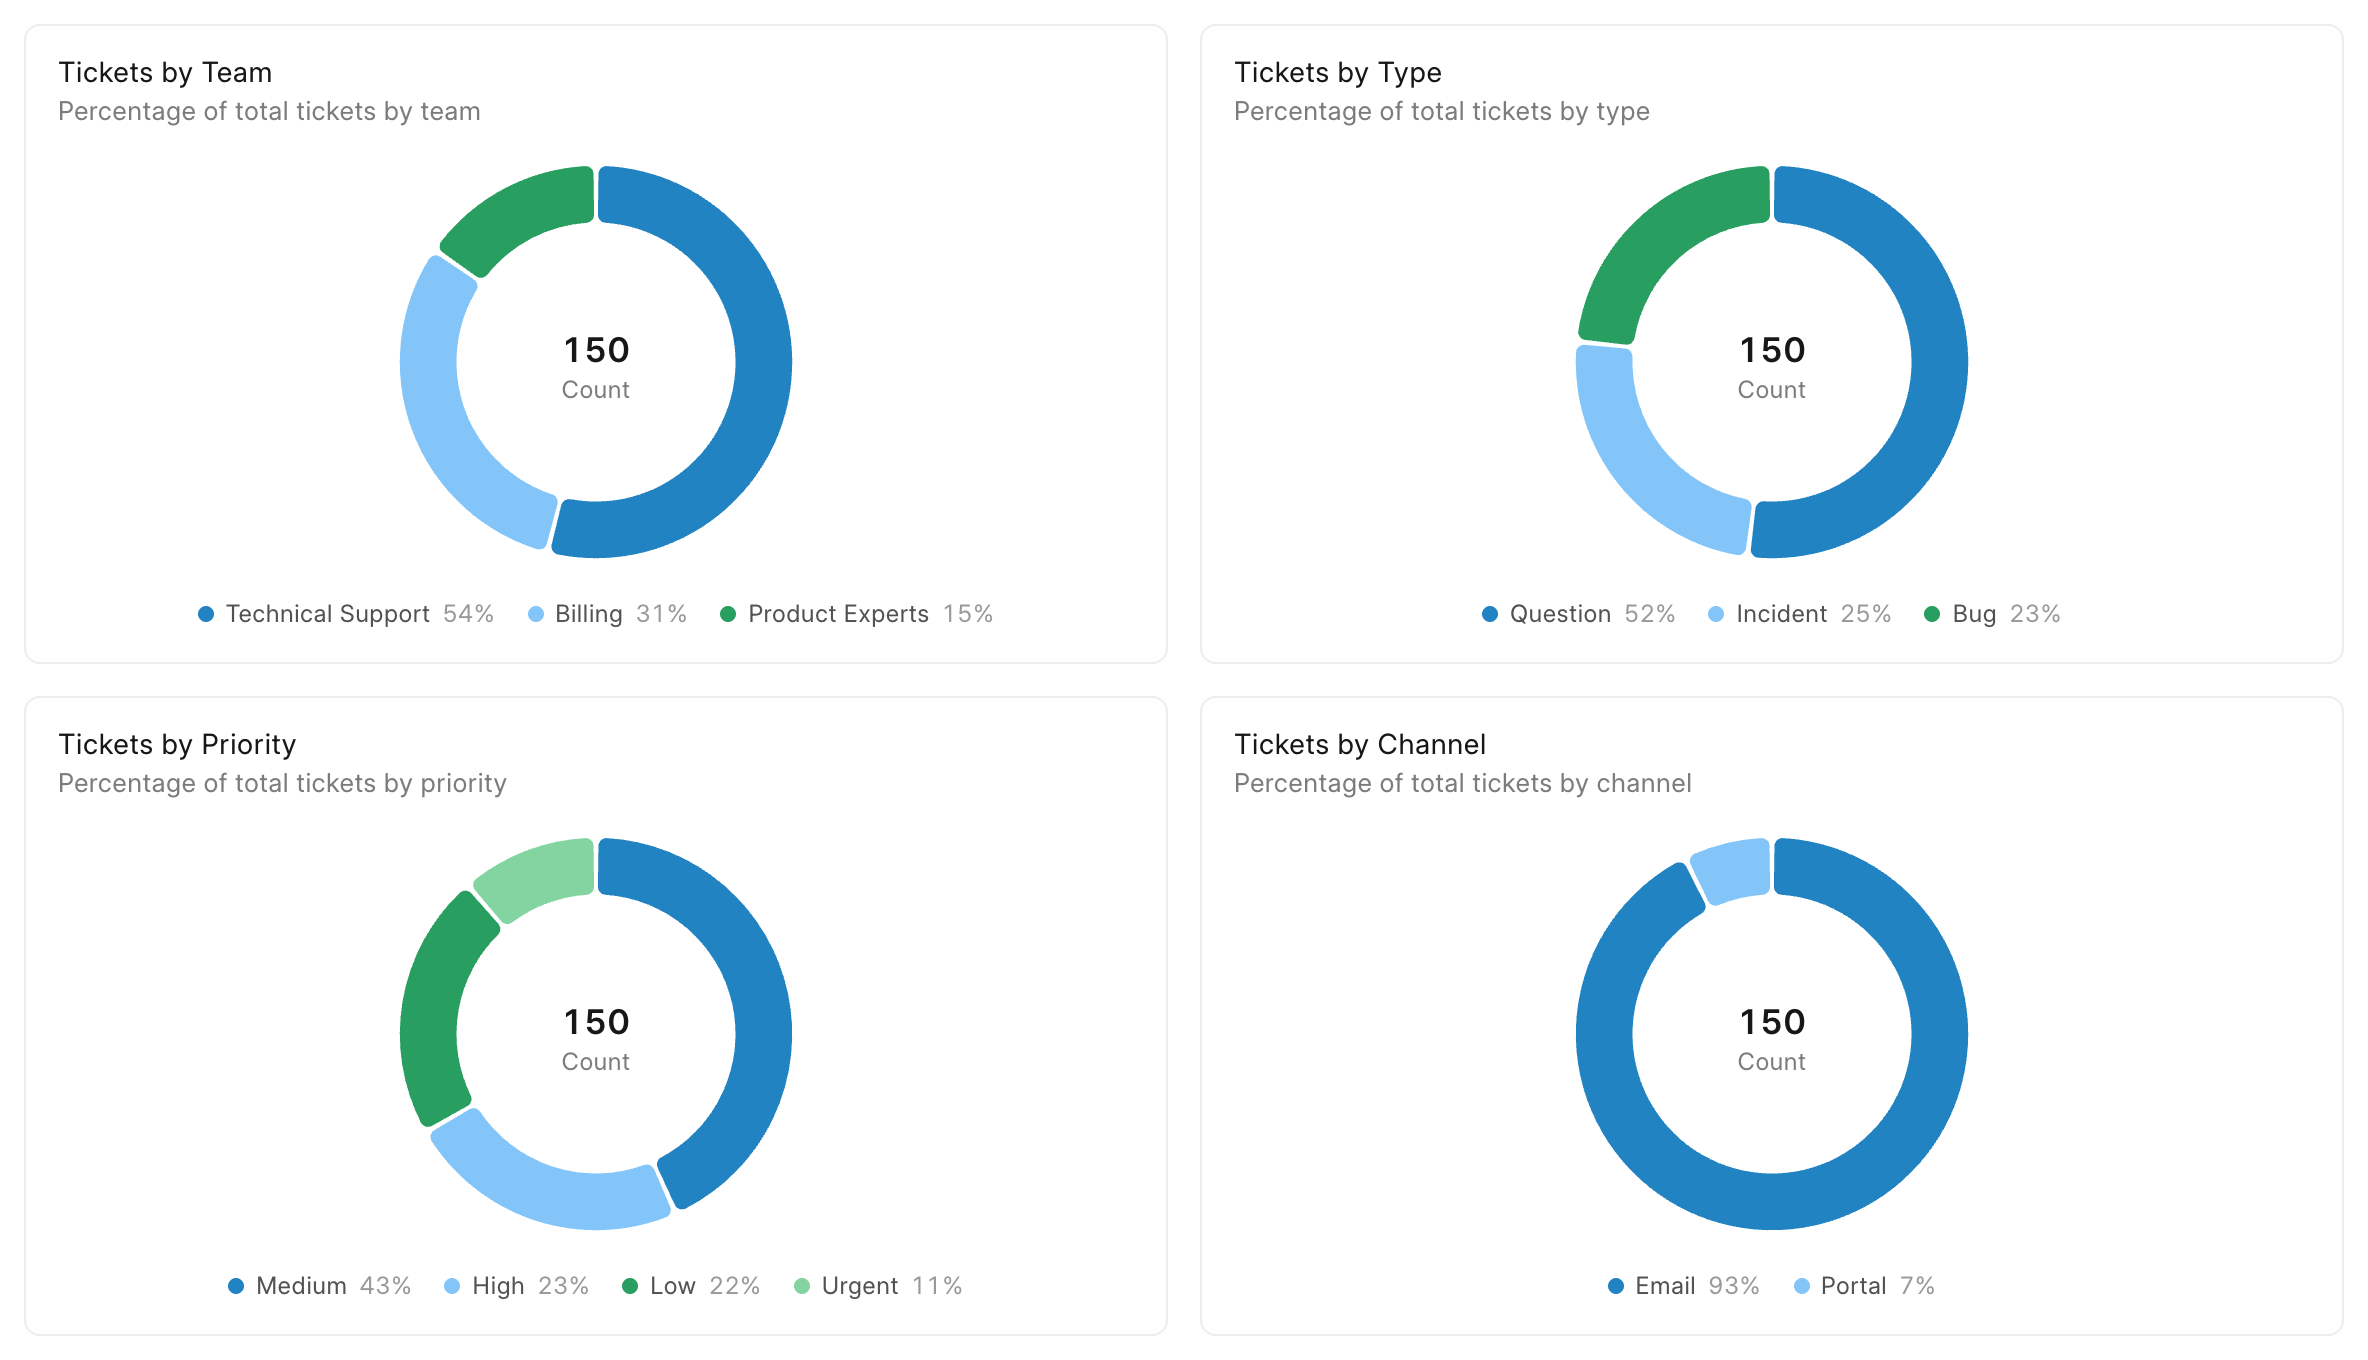
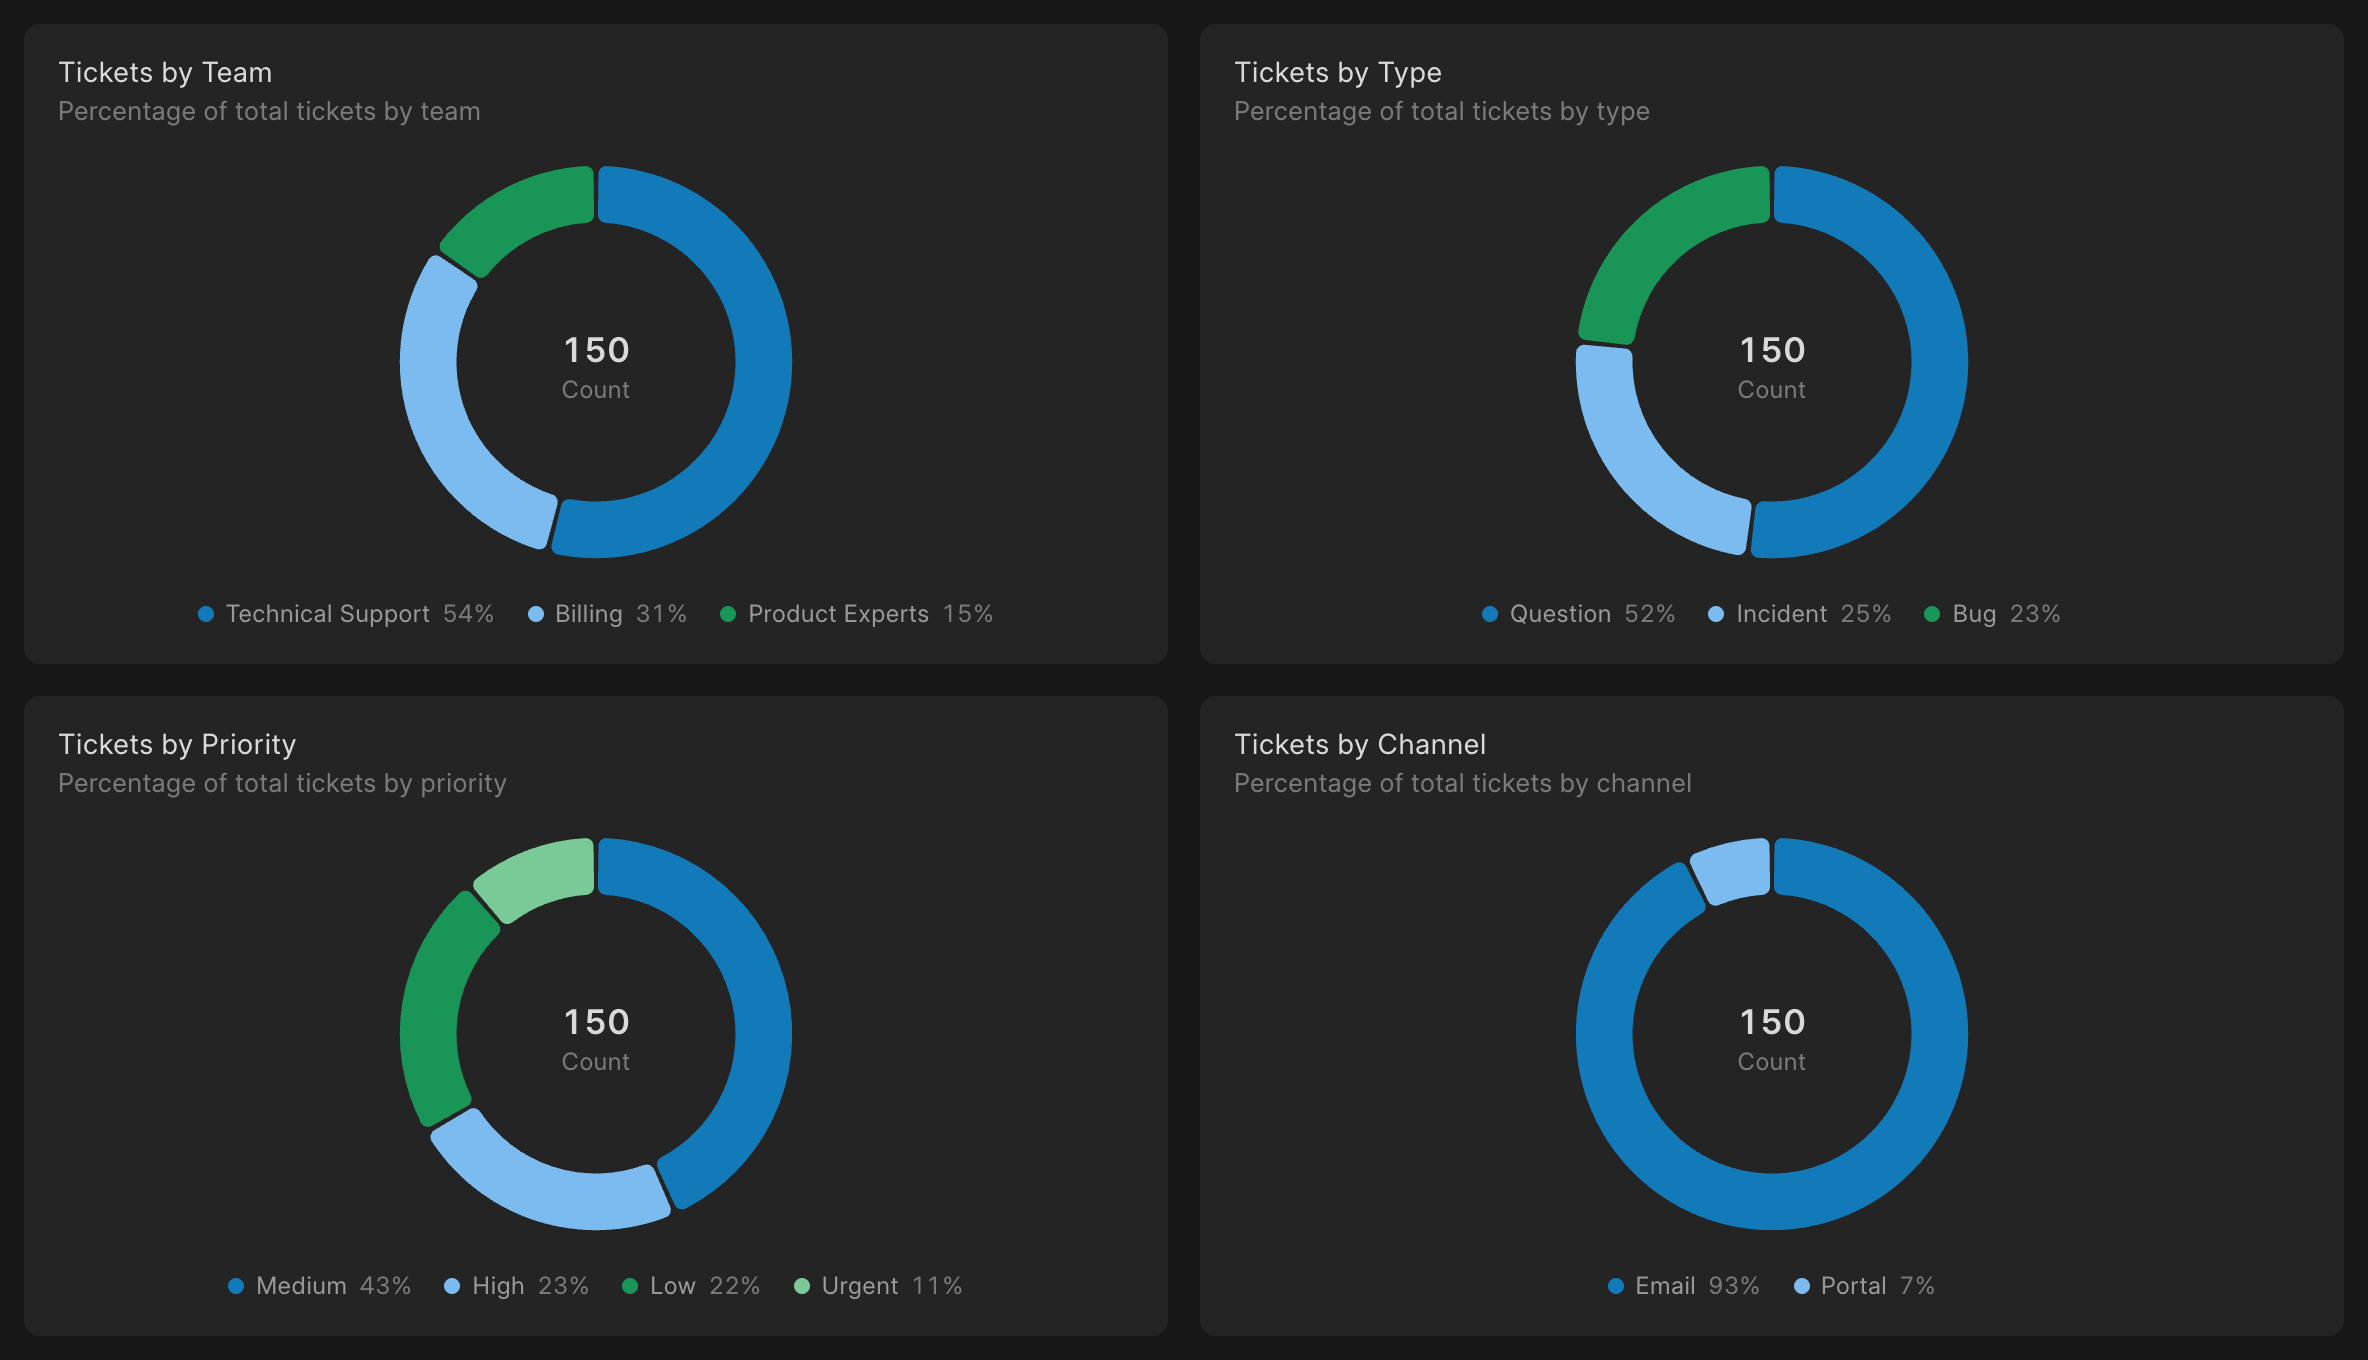
Charts split your tickets by team, type, priority and channel. You can see which team gets the most tickets, how many are bugs or questions, and how many come in by email or through the portal.
Find the issues that keep coming up
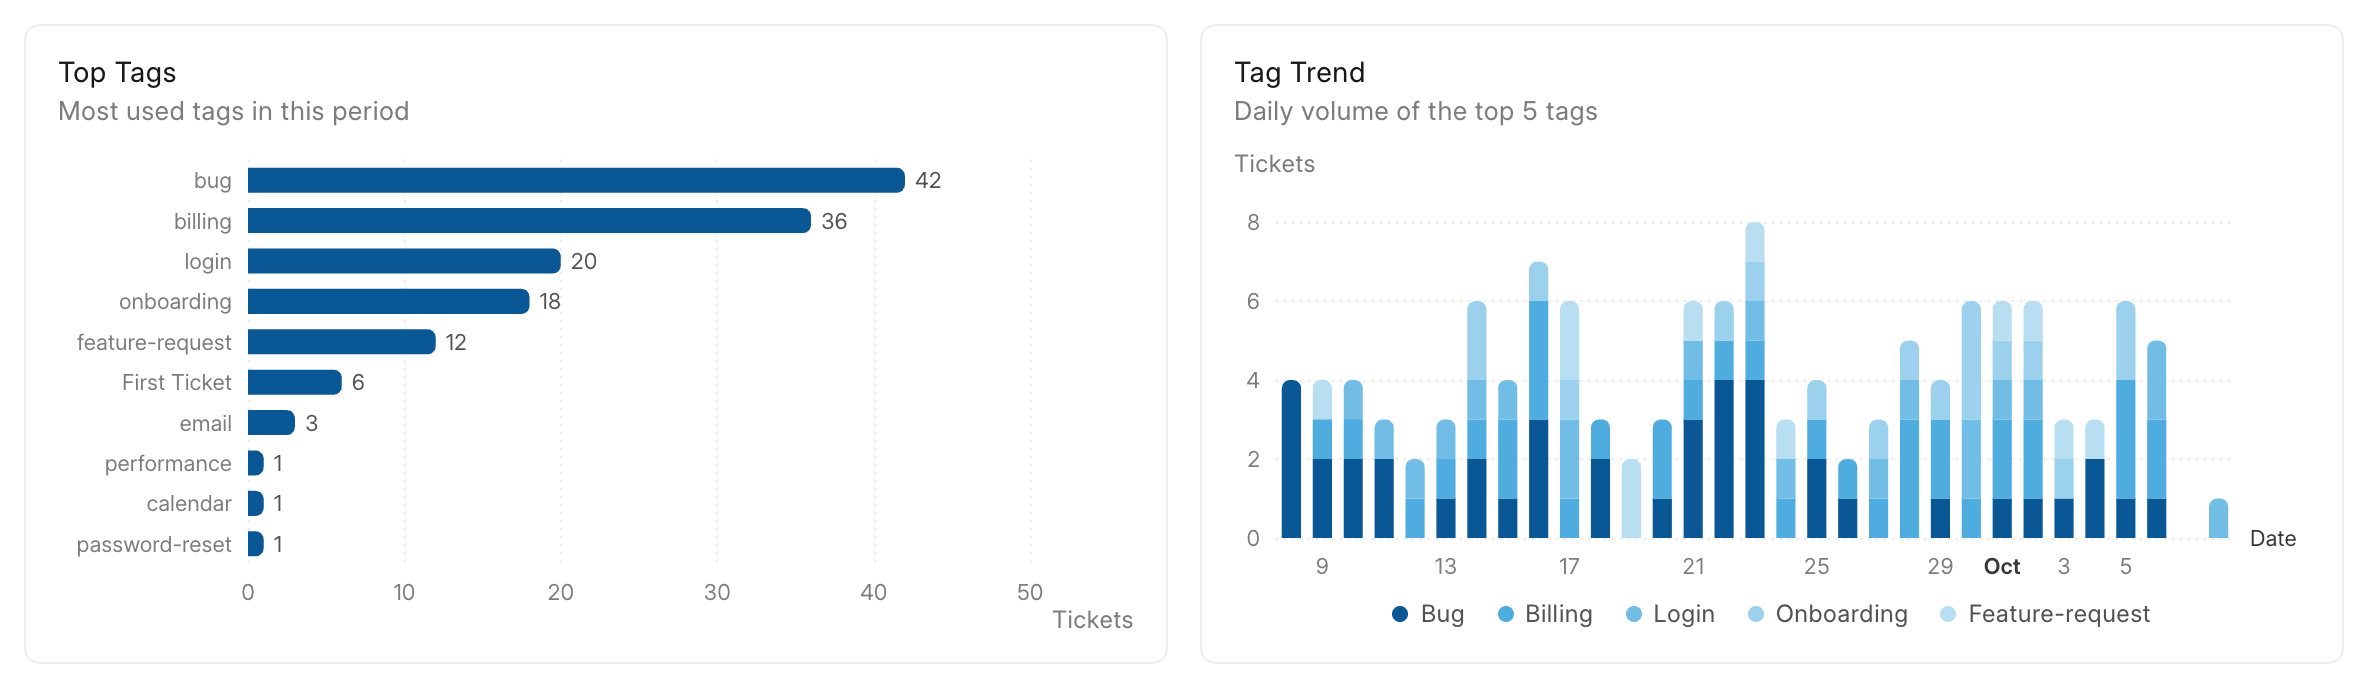
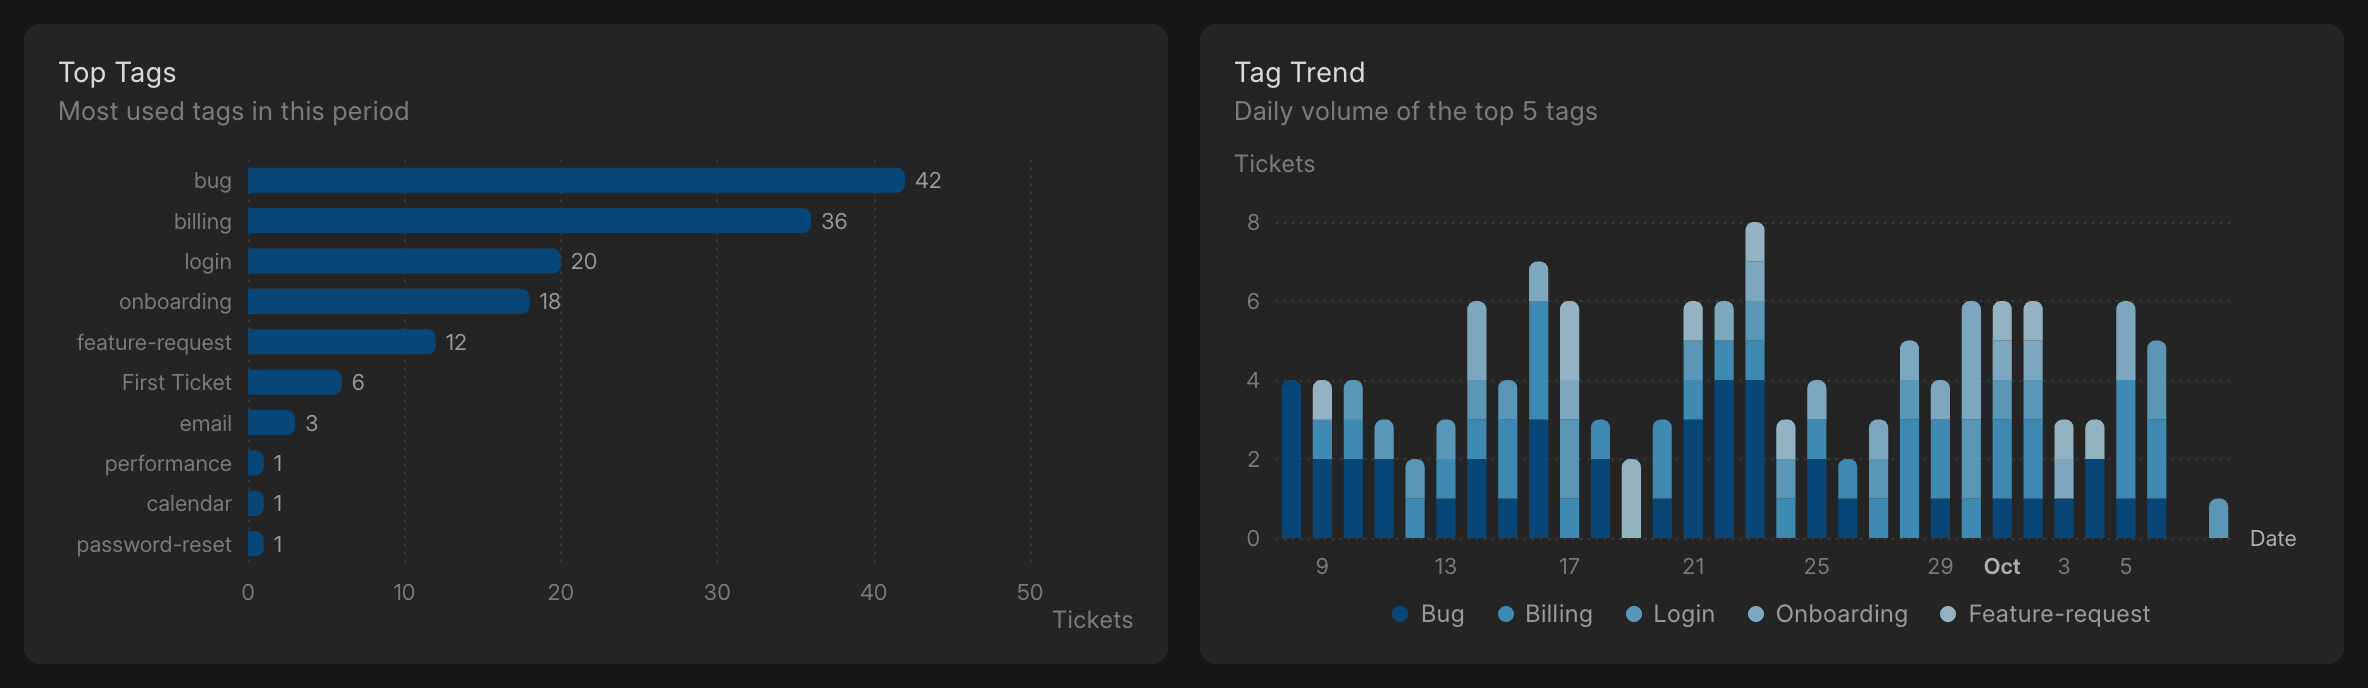
If you tag your tickets, managers also see the most used tags and how often each one came up every day. So if login tickets suddenly go up, you’ll notice it here.
A Home page for every agent
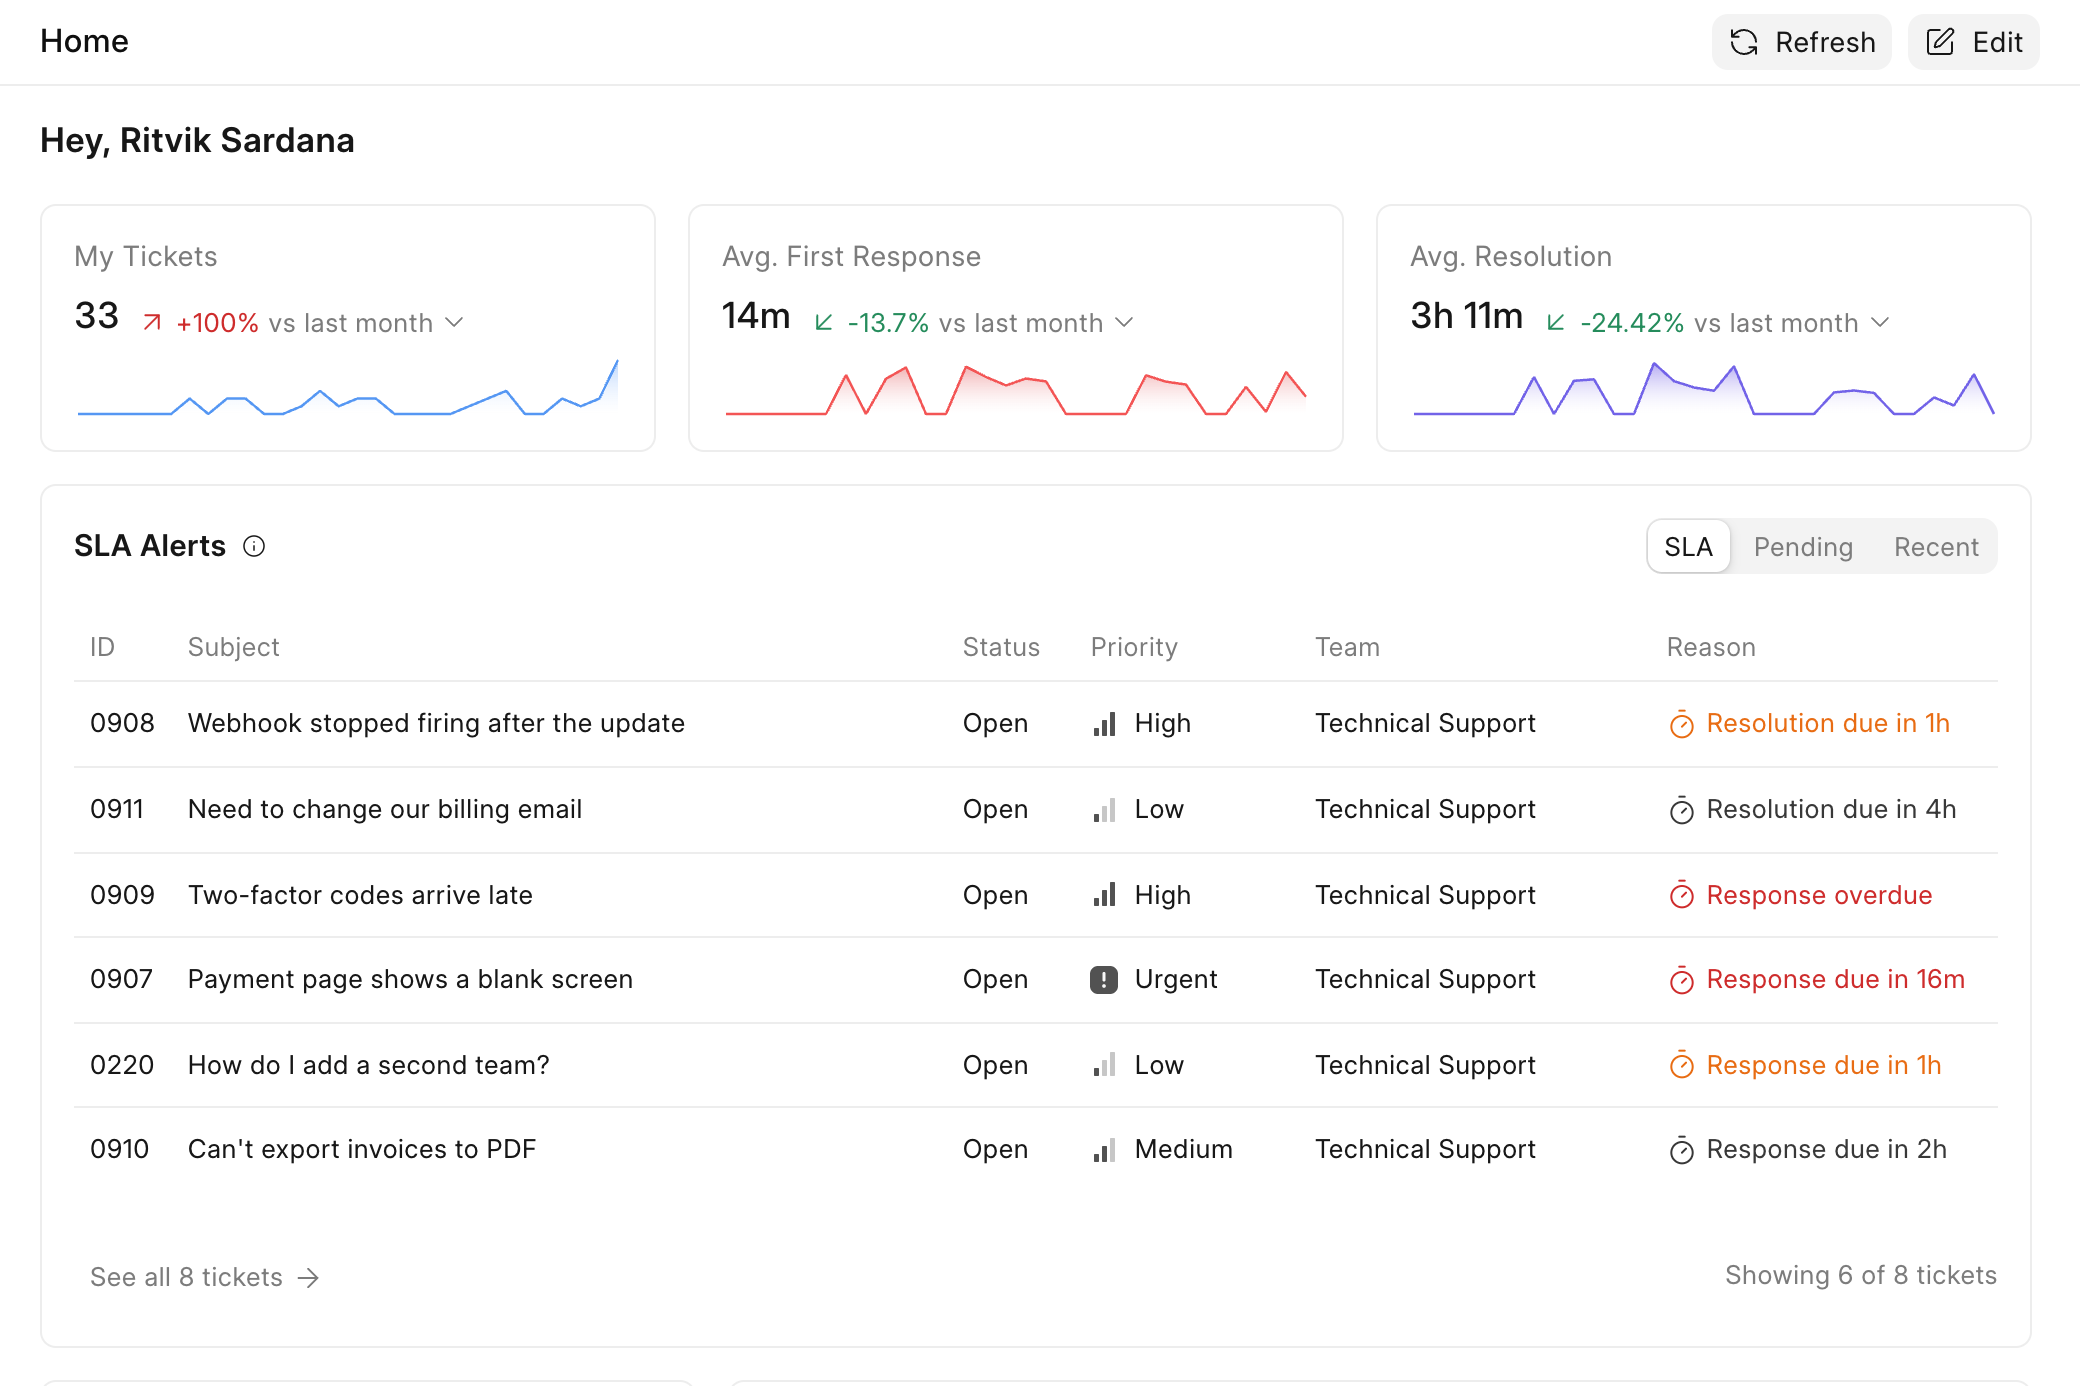
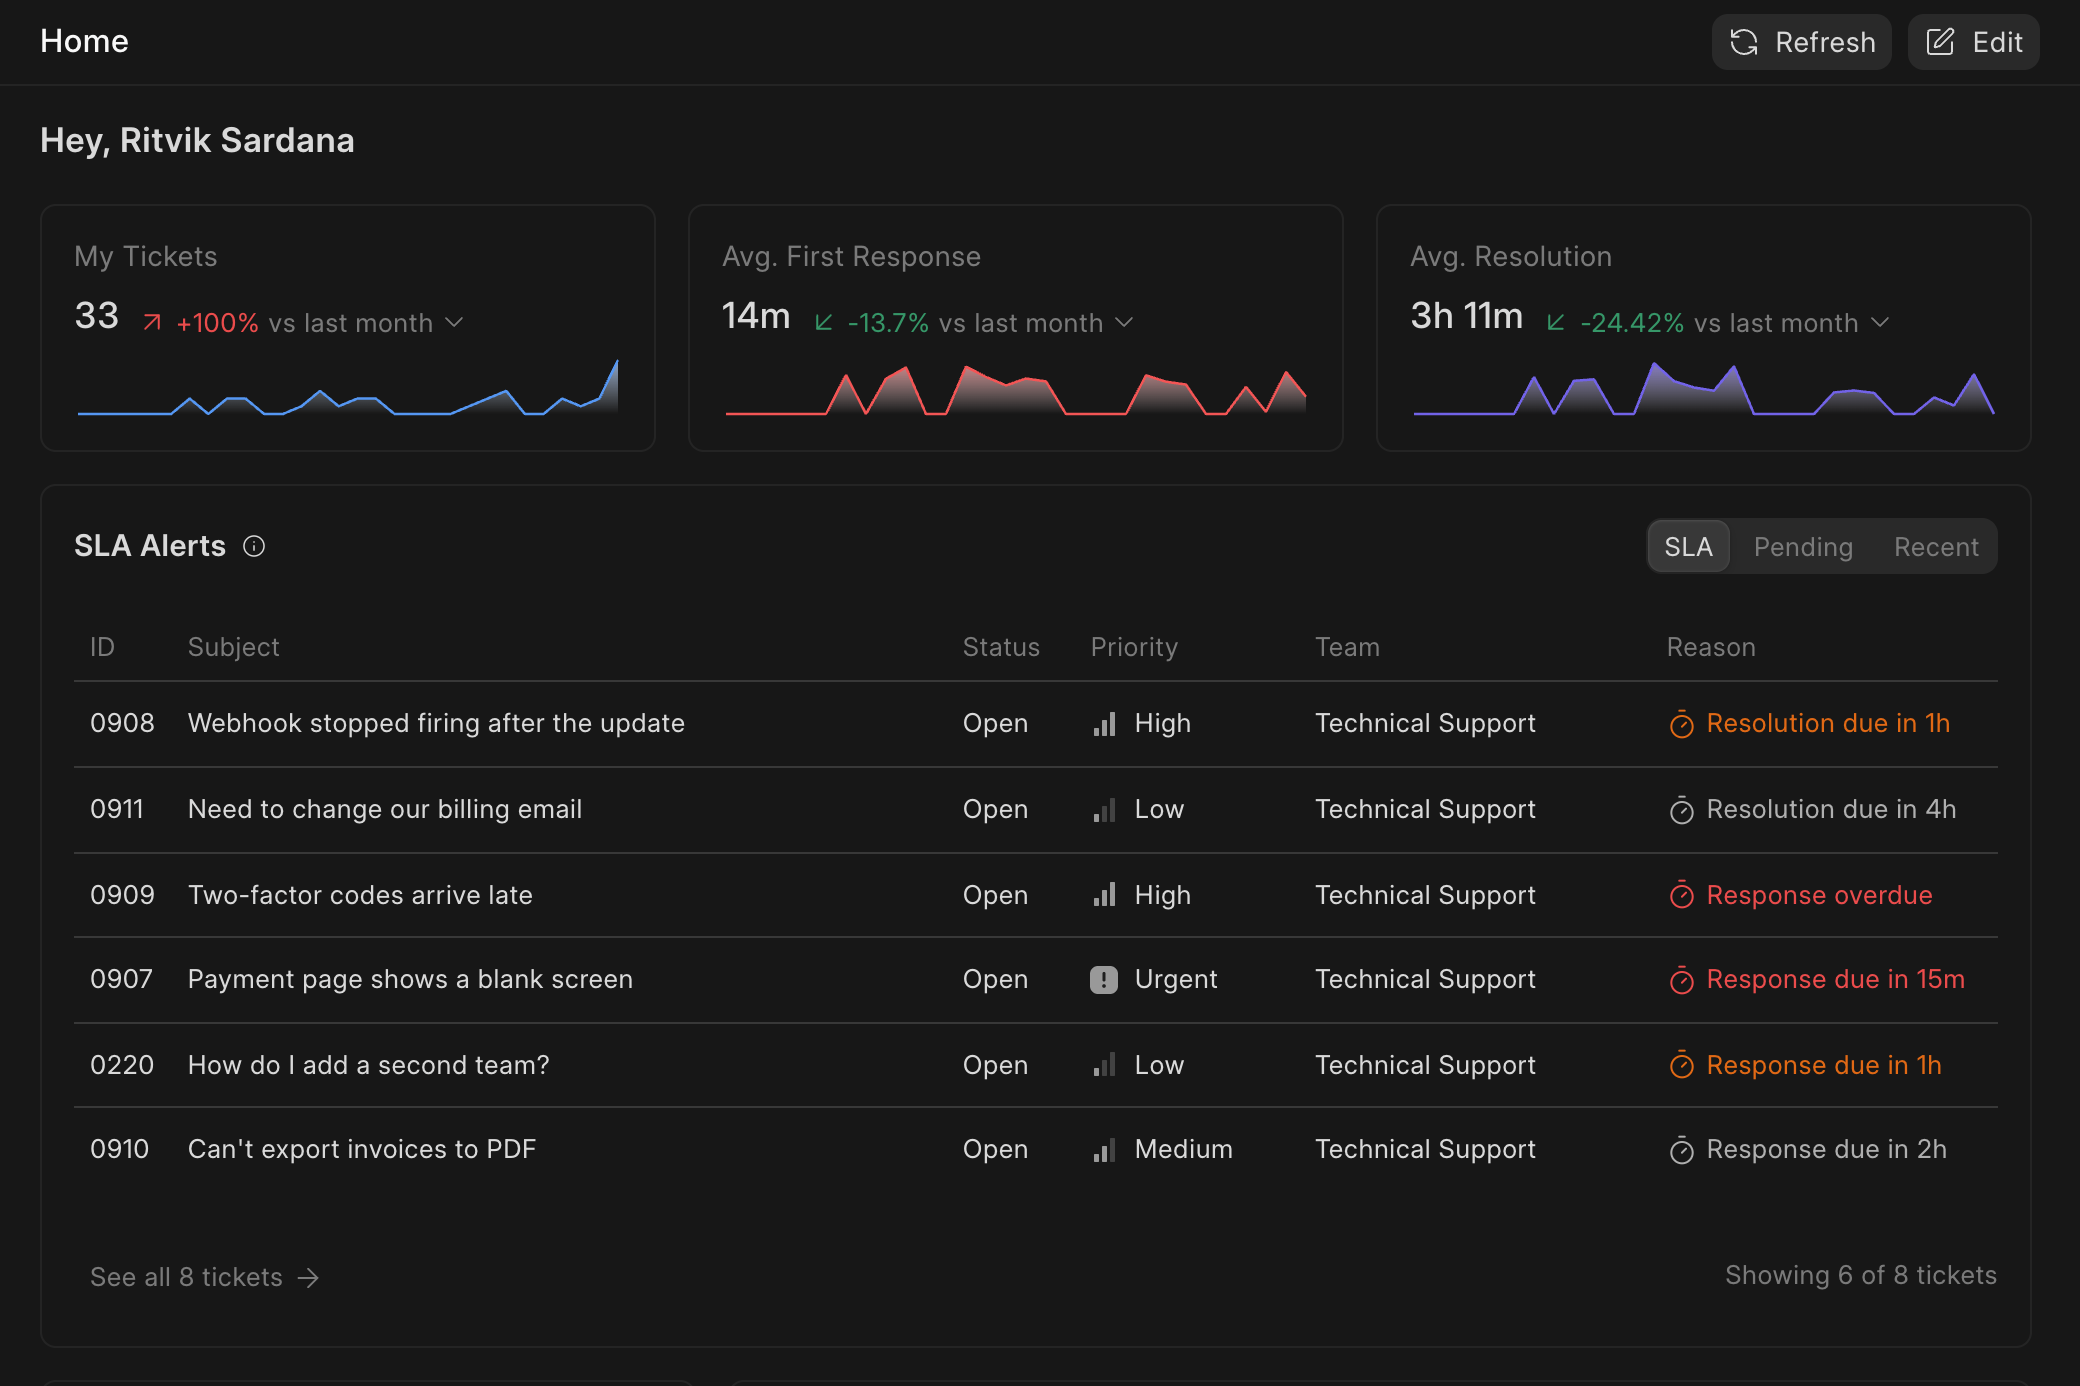
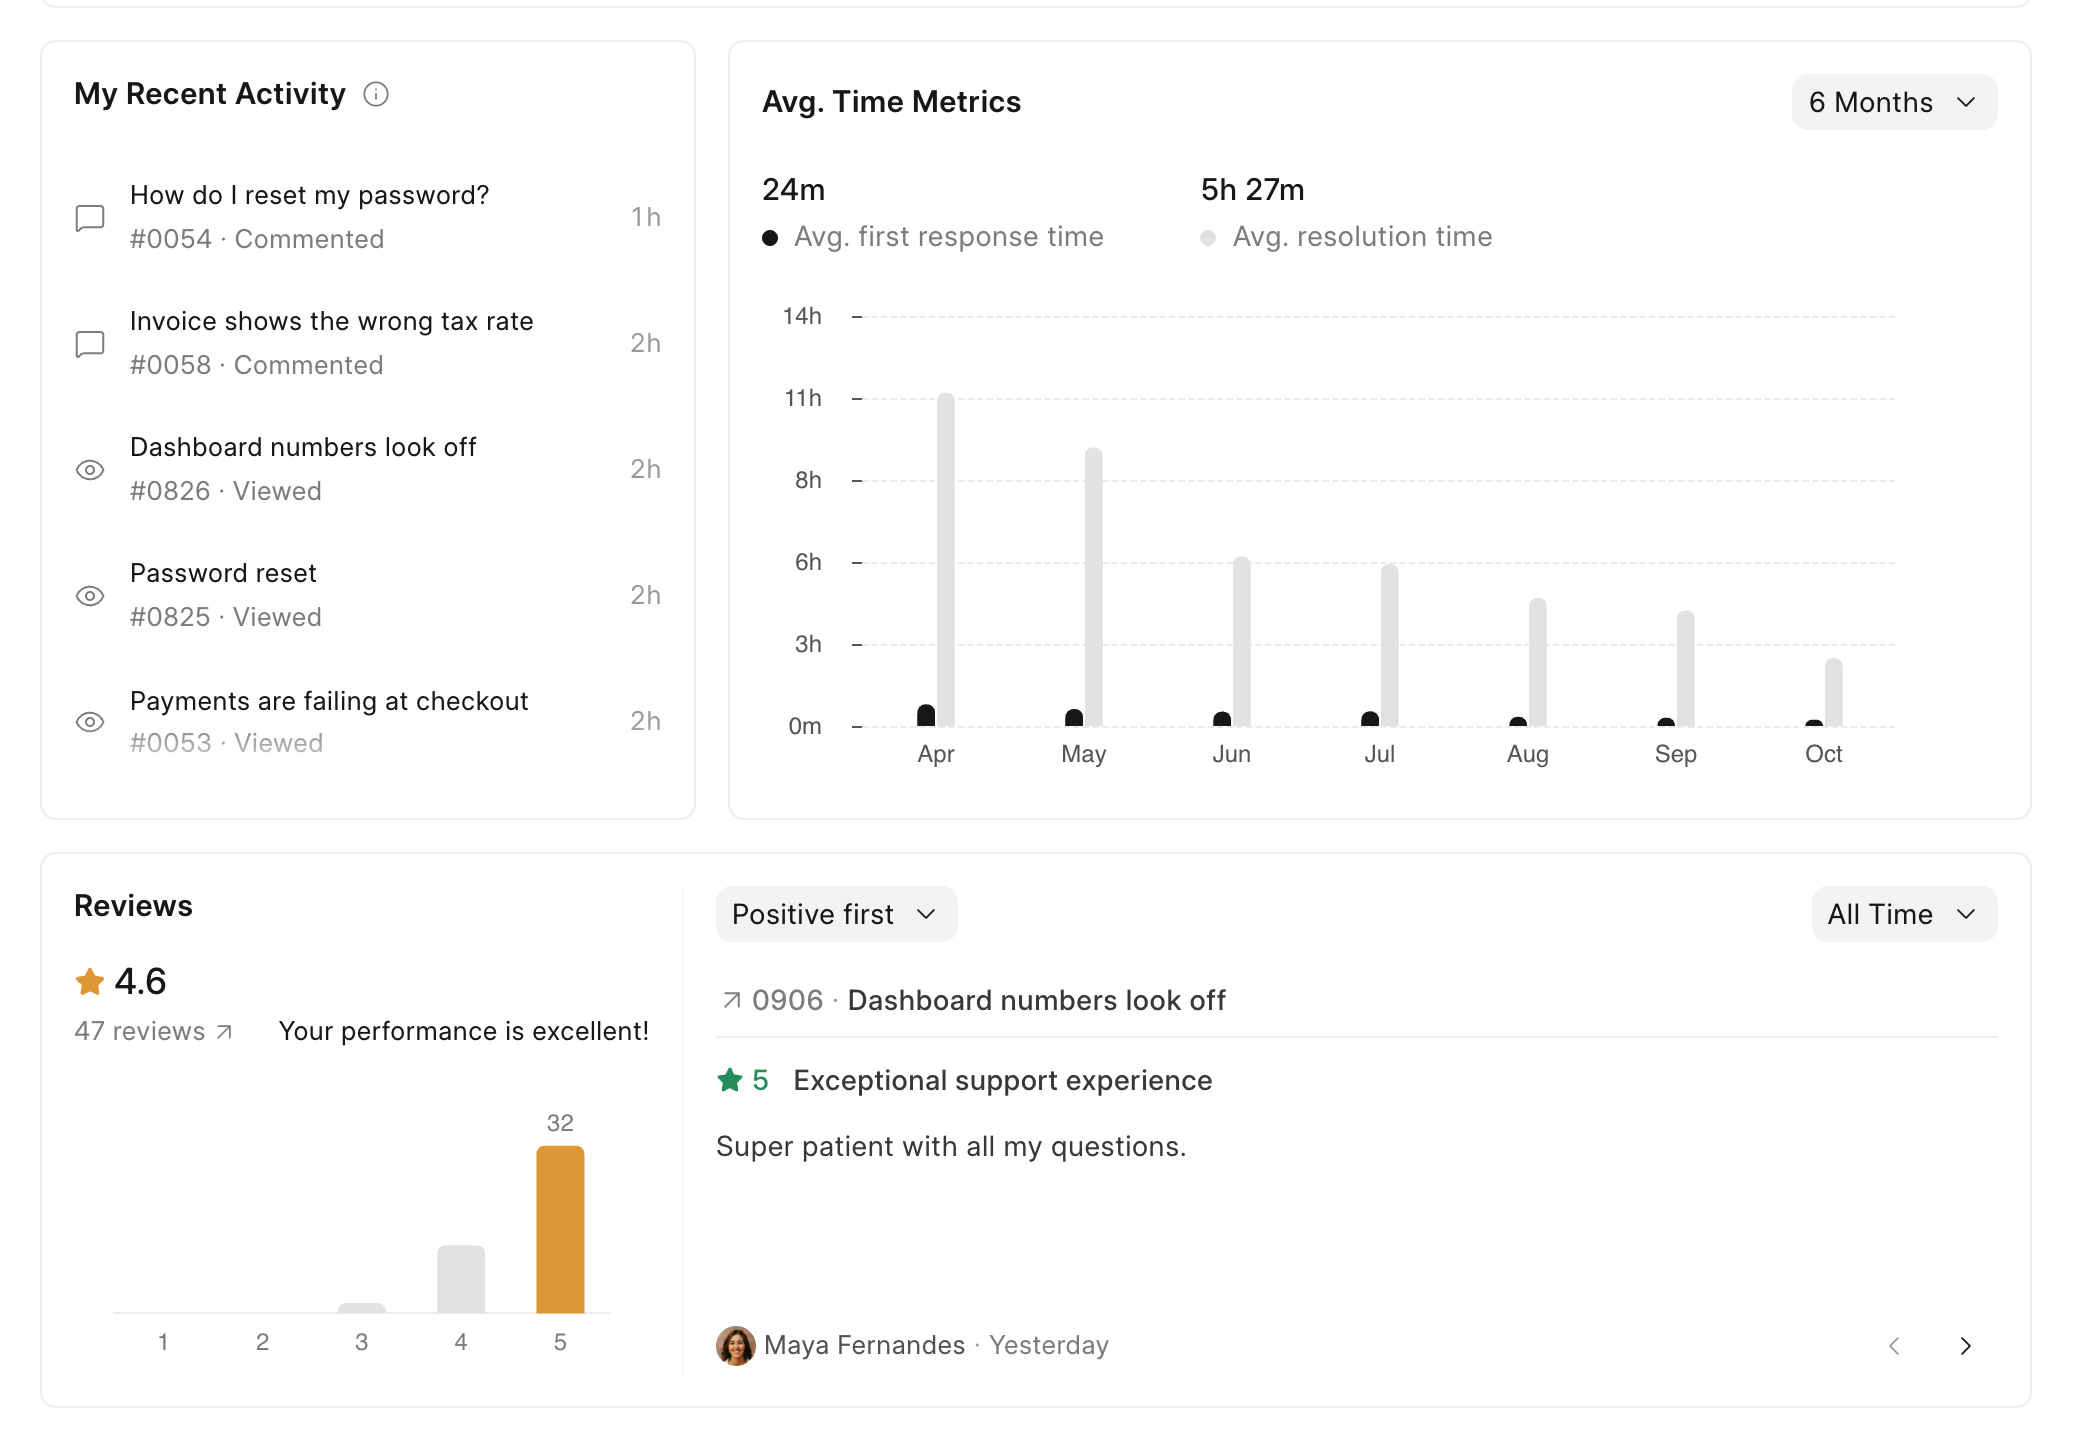
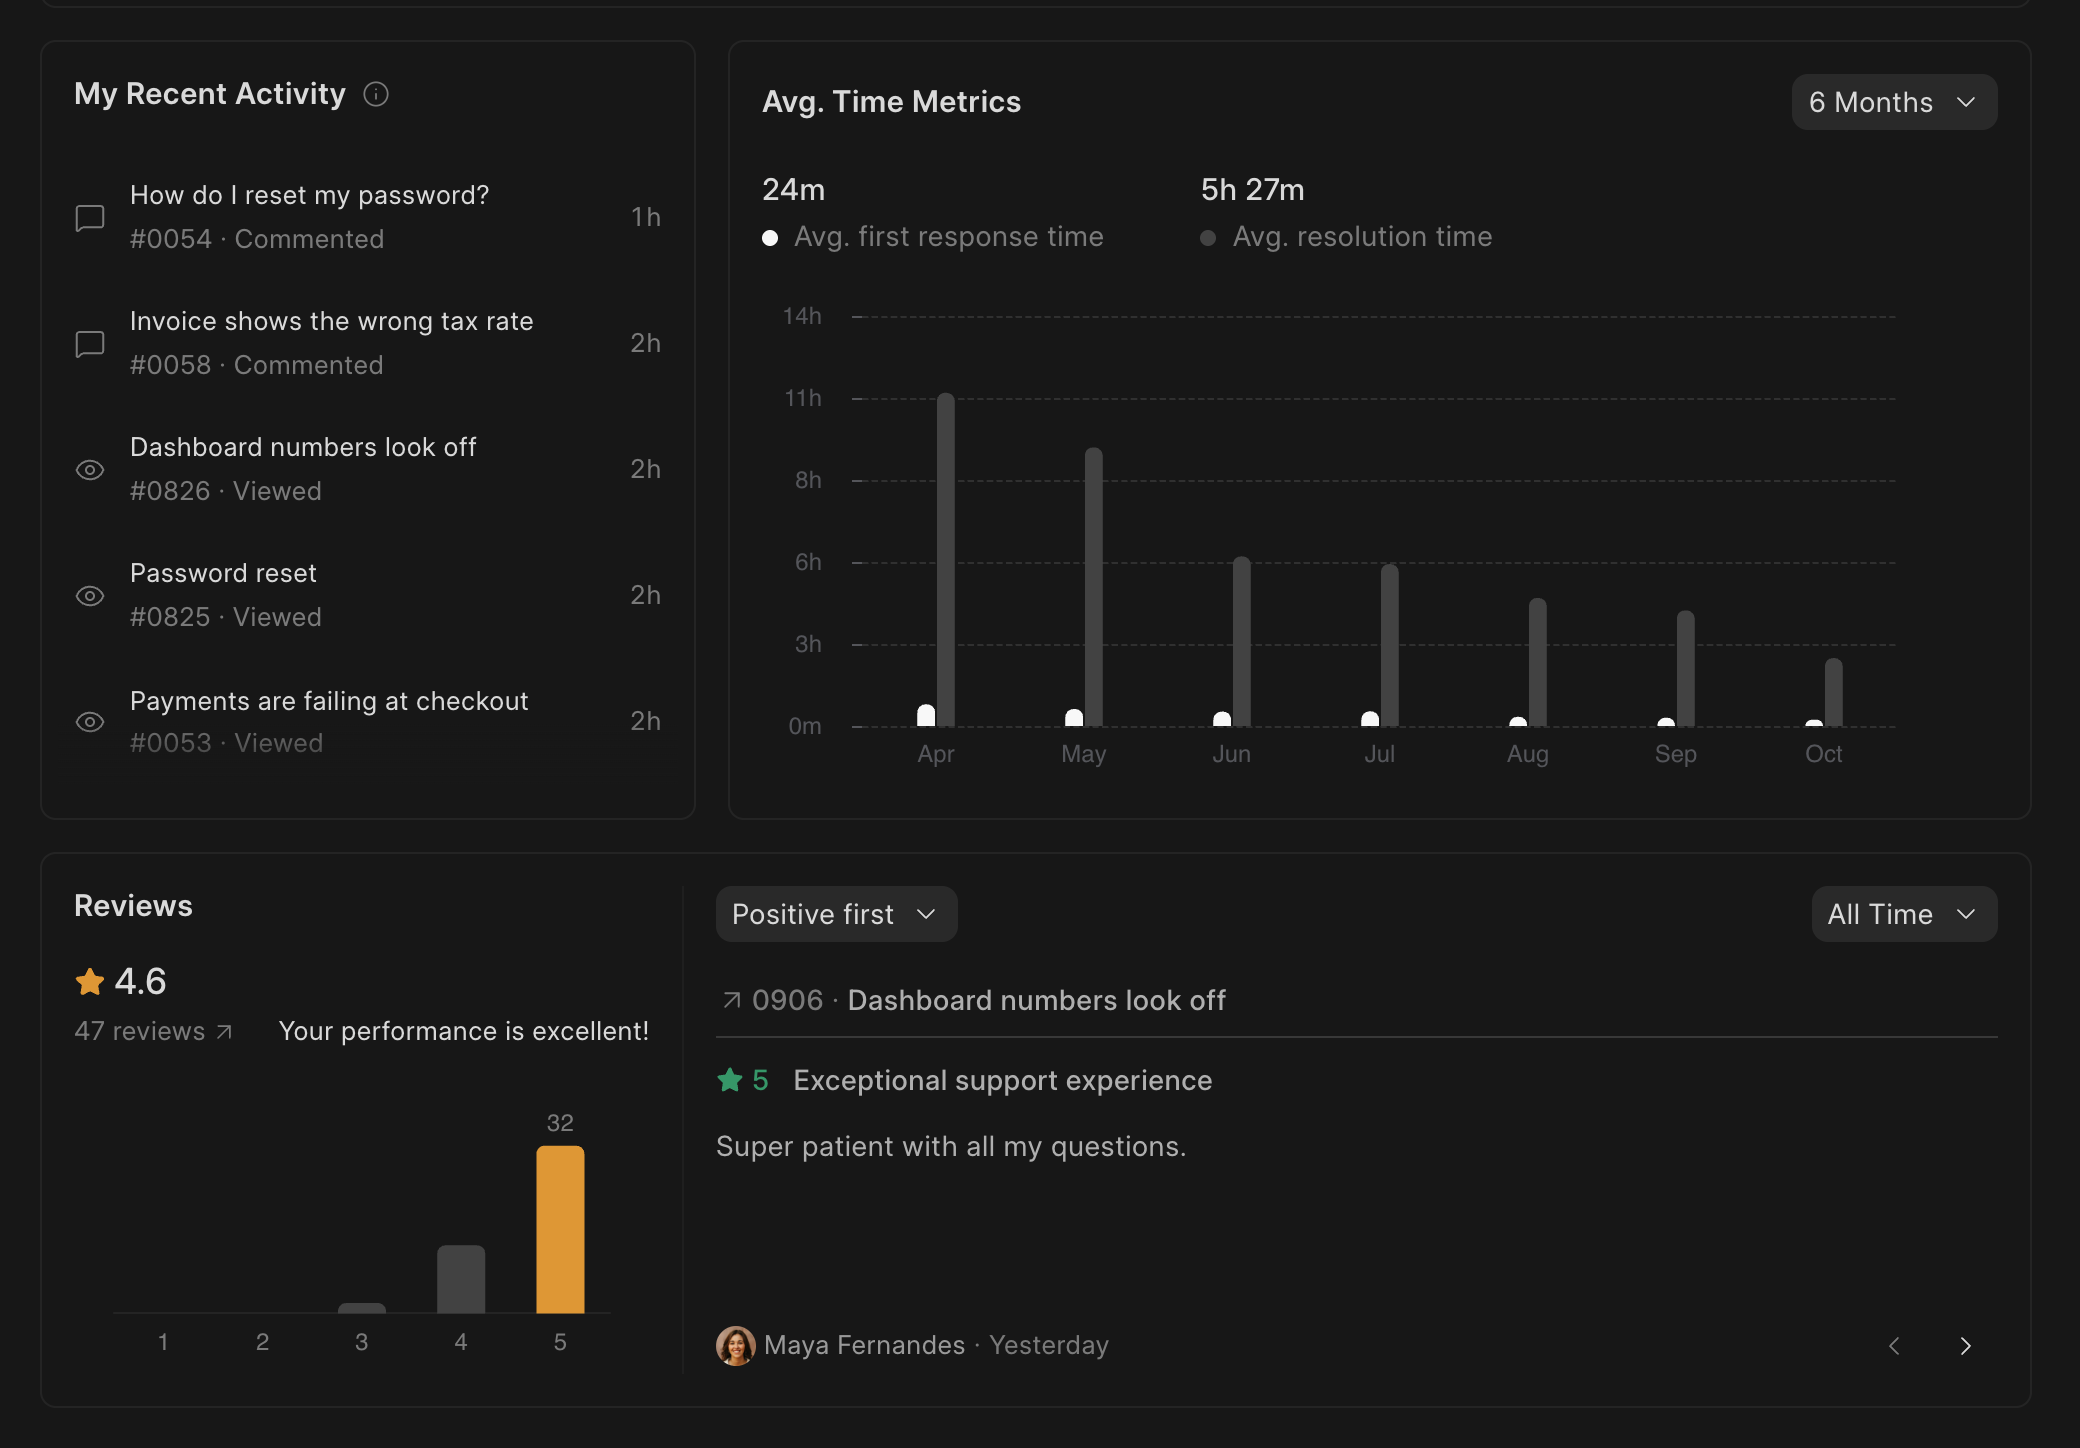
Every agent starts on their own Home page. At the top, they see how many tickets were assigned to them, their average first response and resolution times, and how these compare with the previous month.
SLA Alerts lists the tickets that are due soon or already overdue, so they know what to pick up first. Below that are their recent activity, how their times have changed over the months, and the ratings customers have given them. Agents can add, move or remove cards to set up the page the way they like.
Look back at any ticket
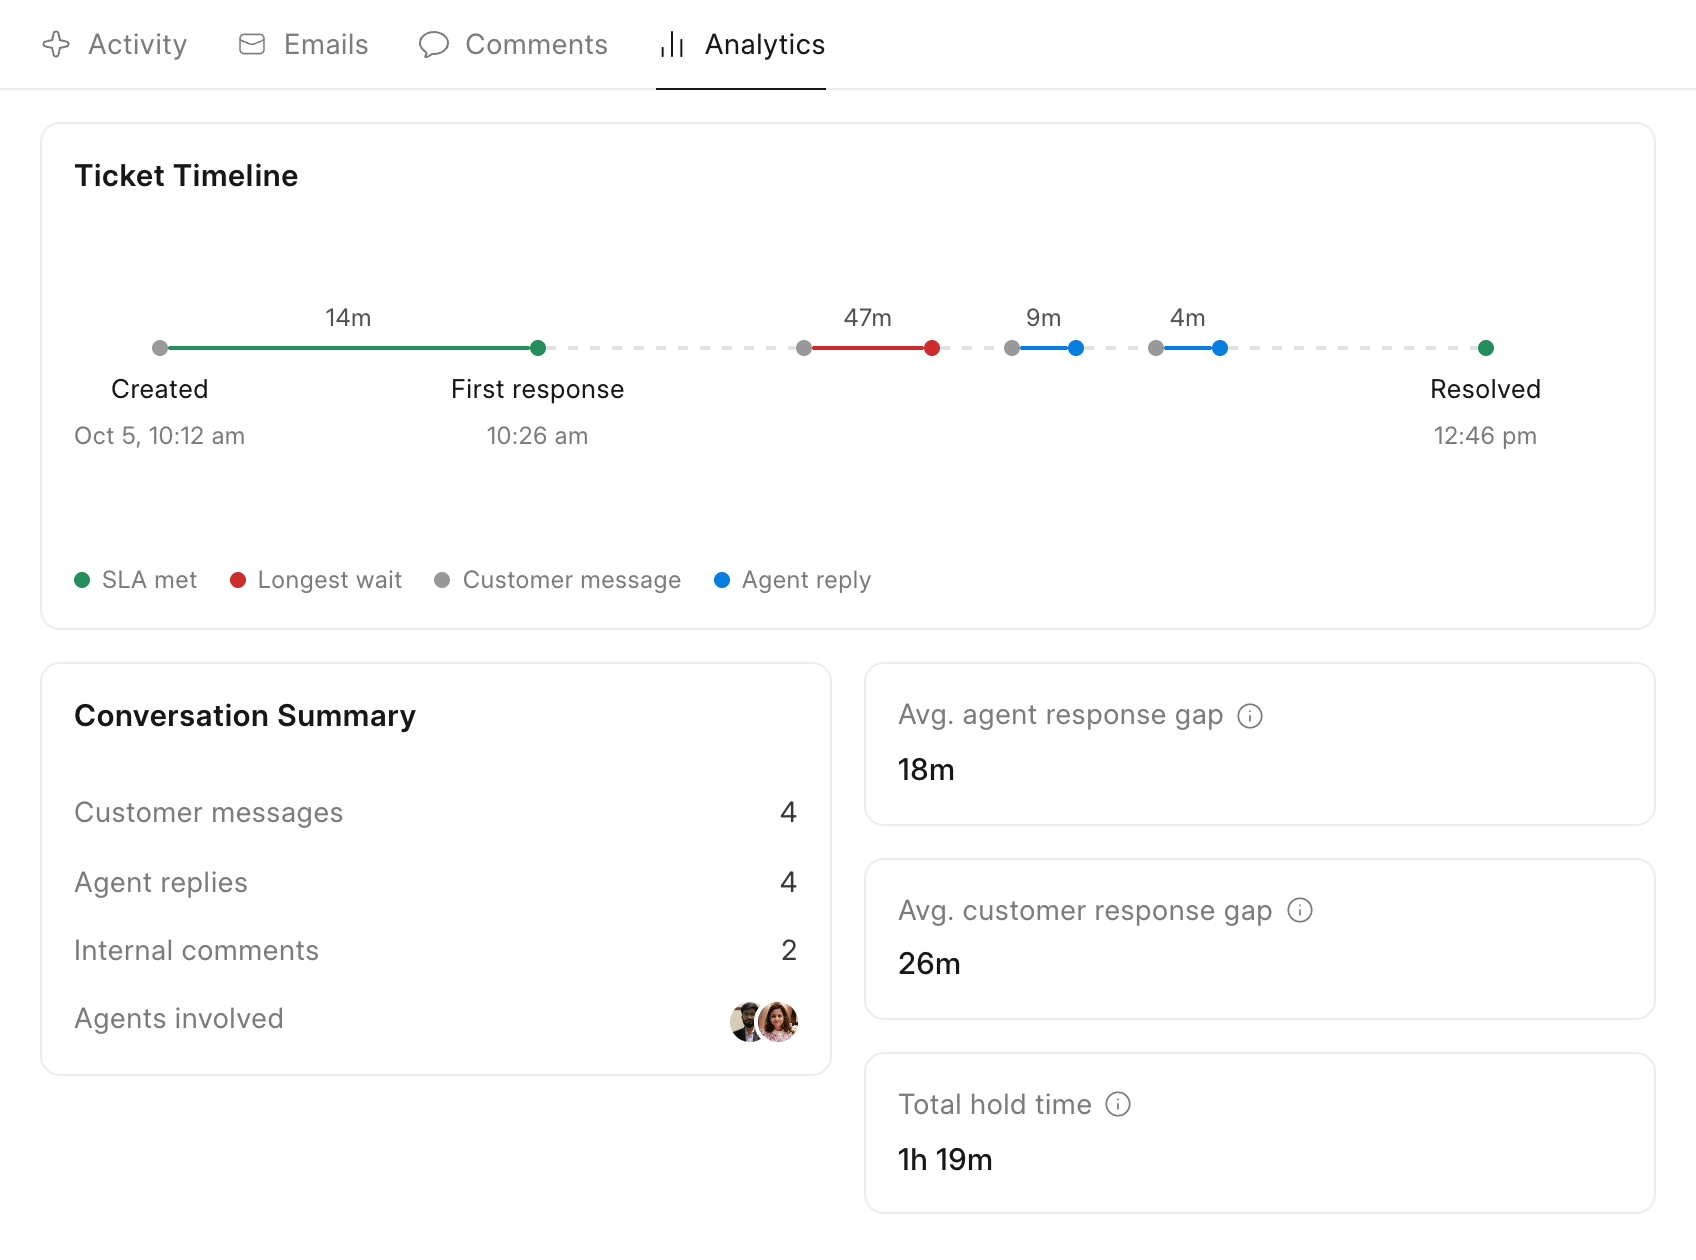
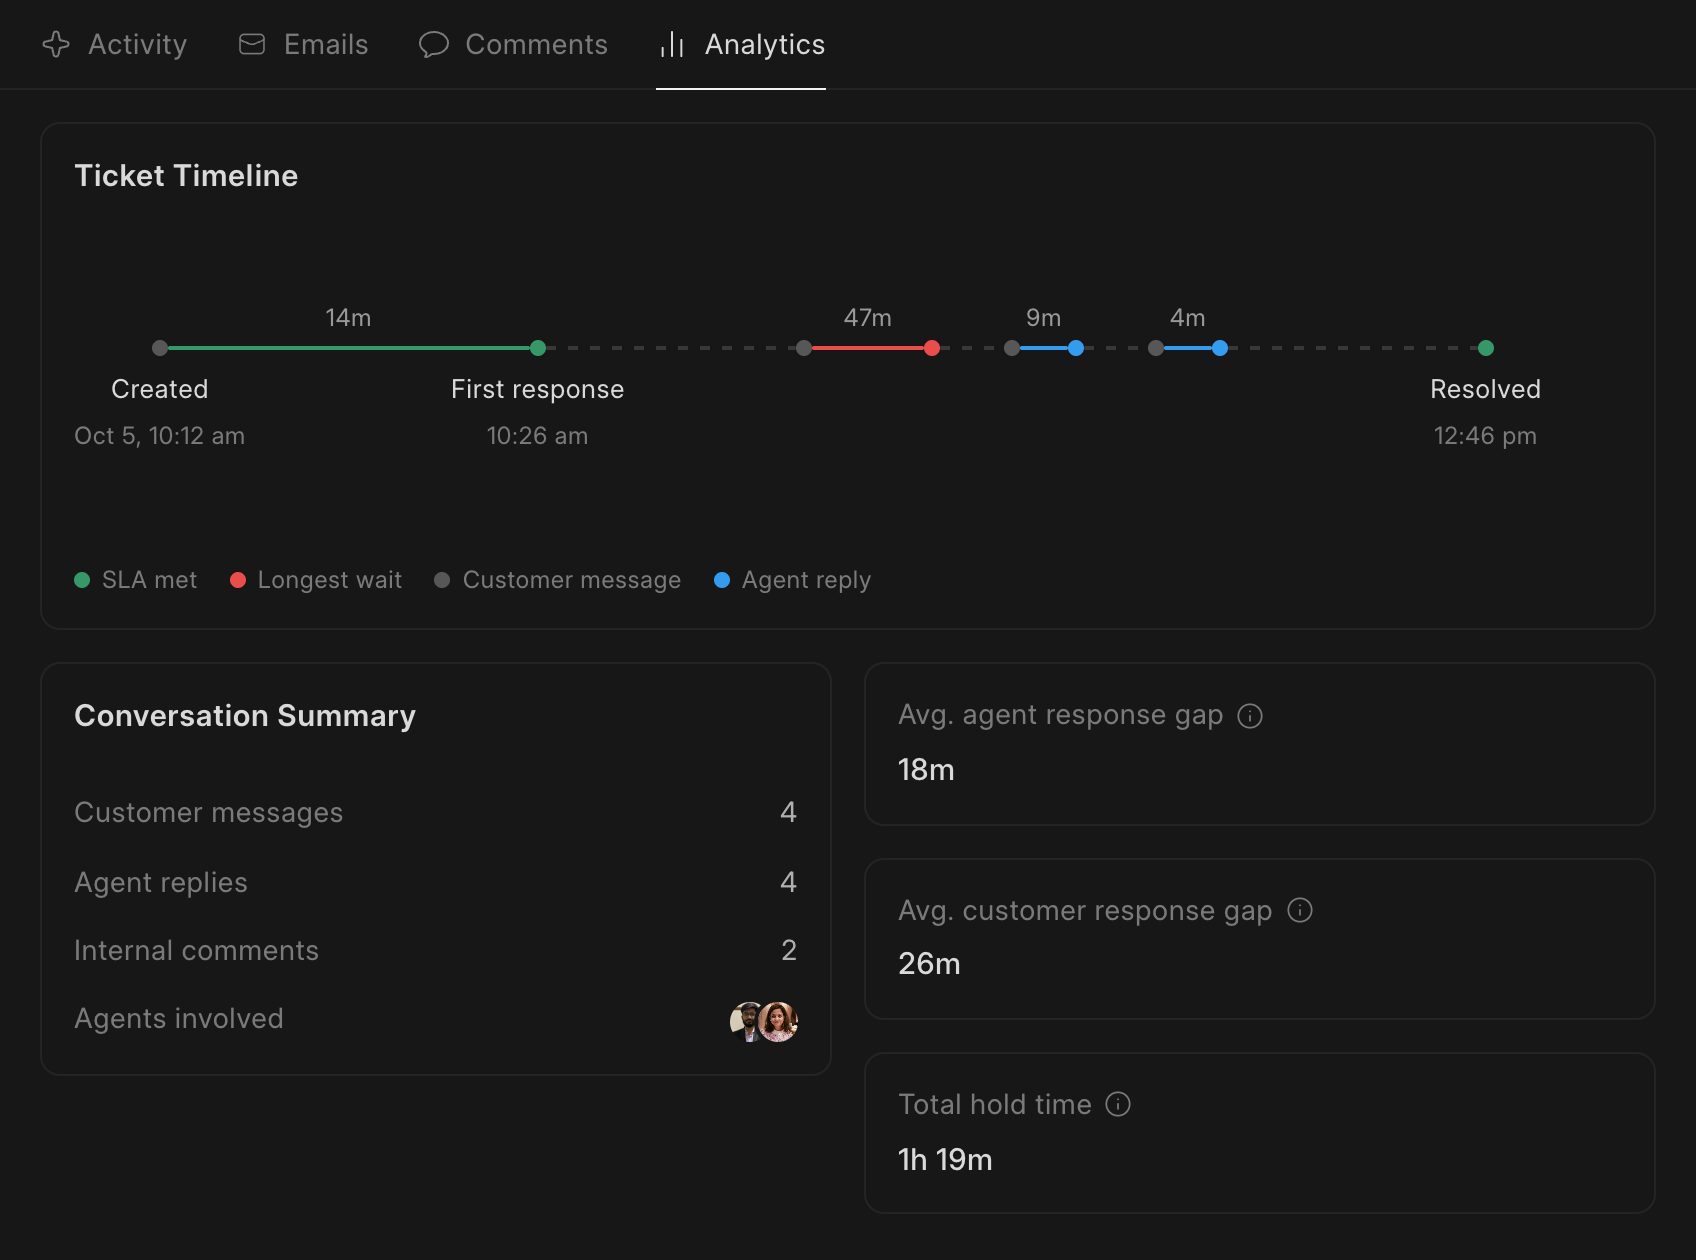
Each ticket has an Analytics tab that shows how the conversation went. The timeline marks when the ticket was created, when your team first replied, every reply after that and when it was resolved. The longest wait is marked in red.
Below the timeline, you see how many messages each side sent, which agents worked on it, the average time between replies and how long the ticket was on hold.
Export your data or build your own reports
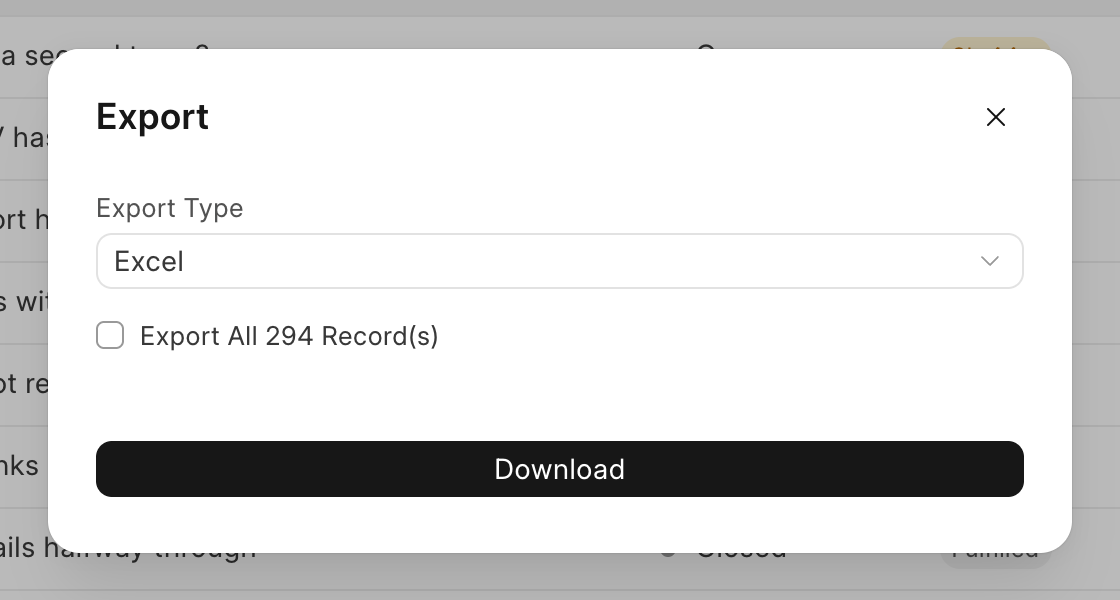
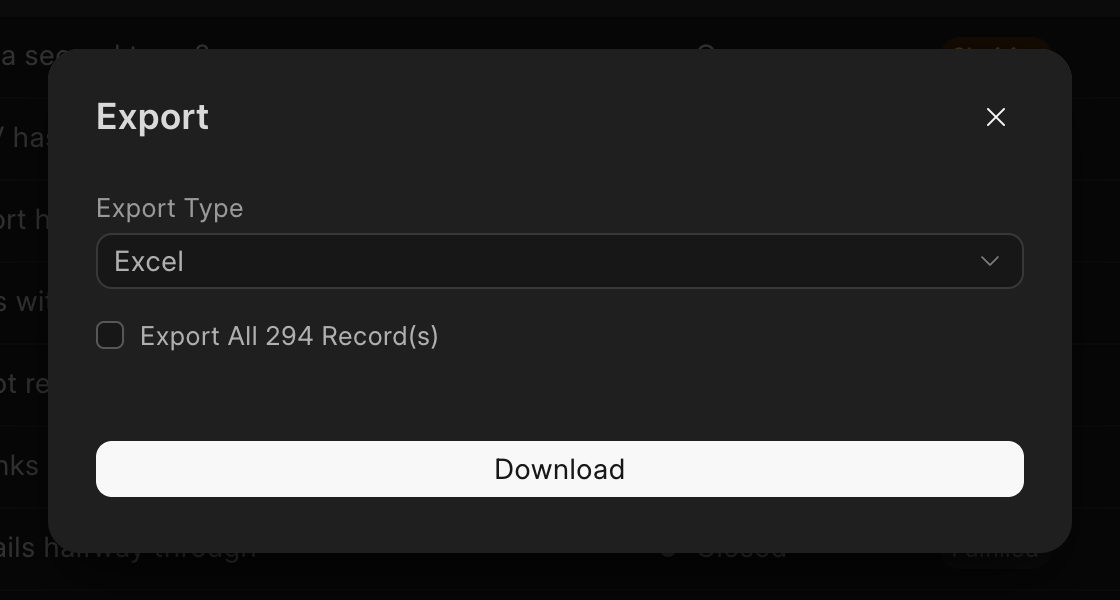
You can export tickets from any list to Excel or CSV. The export uses the same filters and columns as your list, so you get exactly what you see.
For reports the dashboard doesn’t cover, you can use Frappe Insights to build your own charts and dashboards on your Helpdesk data, without writing code.
previous feature
Customer Self-Service
next feature
Integrations