

At Frappe, we host thousands of sites on Frappe Cloud. When a database server goes down, it doesn’t just affect one customer, it impacts every site on that server. So when we started seeing repeated database freezes in our weekly metrics reviews, we knew something was wrong.
Over the past few quarters, most incident categories decreased significantly. However, database incidents kept appearing, with two recurring patterns: sudden disk I/O spikes followed by complete database freezes that made servers unresponsive. Every week, we observed 5–6 such incidents on both shared and dedicated.
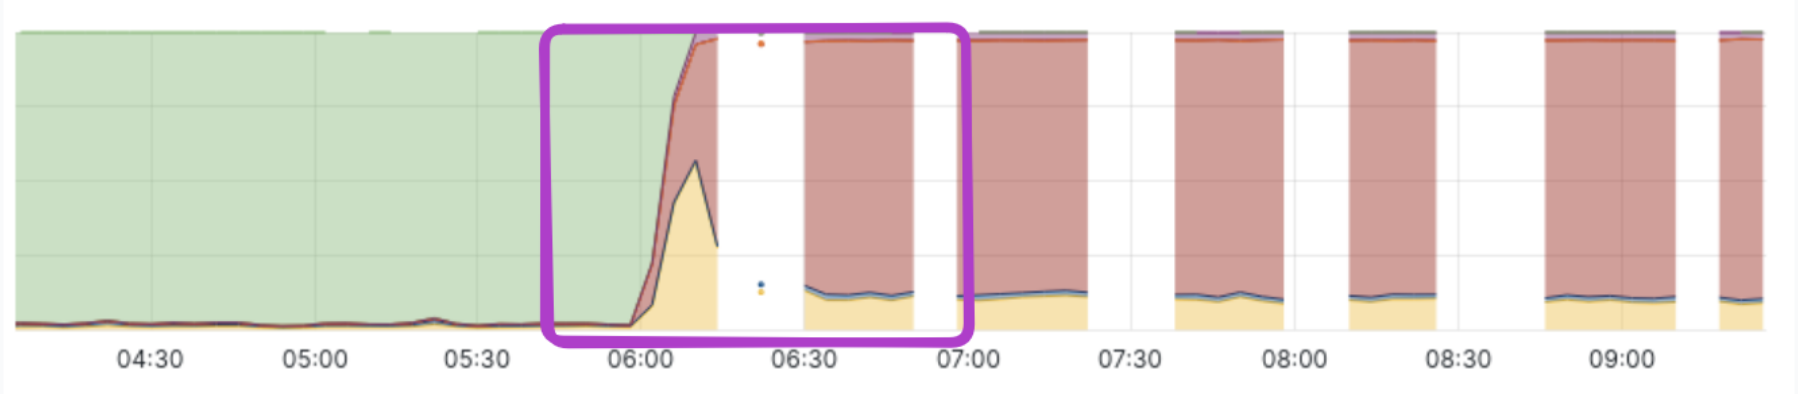
If these were caused by simple resource exhaustion, the fix would be straightforward: upgrade the database server. But these failures were different. The spike and freeze pattern suggested something was triggering a sudden burst of activity, not a gradual buildup.
First, we needed to identify the trigger.
The observability problem
This turned out to be harder than expected to investigate. When a server comes under heavy I/O pressure, the disk queue fills up and even routine OS operations start waiting for disk access, including the SSH daemon and the metrics exporters we rely on for monitoring. At exactly the moment we needed visibility, the system effectively went dark.
Our monitoring pipeline relies on collecting metrics at fixed intervals, but under heavy load, exporters often fail to respond in time. As a result, critical data was simply never captured.
To debug this, we needed visibility into why the system was under stress. Two questions mattered most:
- What queries were running during the incident?
- What files or tables was the database reading or writing?
Tracing database I/O with eBPF
The first question was easy to answer using MariaDB’s process list.
The second required tracing disk activity. For this, we used eBPF, a Linux feature that lets you attach small programs directly to kernel functions and observe what's happening inside the OS. Think of it as placing a silent observer at the kernel level, without modifying the kernel itself.
We wrote a small eBPF program to track MariaDB’s I/O activity. That tool uses two eBPF hooks:
kprobe/vfs_readandkprobe/vfs_write: These are triggered when a process performs a read or write operation.kretprobe/vfs_readandkretprobe/vfs_write: These are triggered after the kernel has processed the request and returns the data to the process.
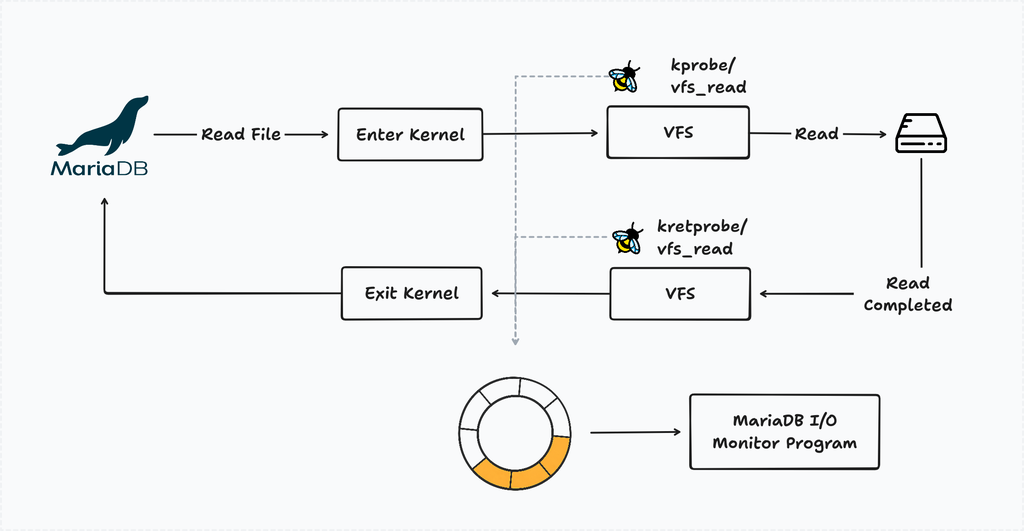
By pairing entry and exit events for each file descriptor, we could detect stalled I/O: if a vfs_read was initiated but never returned, the disk was struggling to keep up. Each time this occurs, the I/O monitor logs the findings for further investigation.
Keeping the hooks active causes slow I/O, so we introduced a resource monitor. It watches for spikes in CPU iowait or disk activity and attaches the eBPF probes on-demand.
For reference, you can check the eBPF program and event processor code to know more.
The suspicious query
After collecting traces from multiple servers, we noticed a pattern: just before most crashes, a query like this appeared:
SELECT (data_length + index_length)
FROM information_schema.tables
WHERE table_schema = '_ed43434dsl5f';
The query was often stuck in the state “Opening tables.”
At first glance, it looked harmless. We use it in several places, both in the agent and the framework to calculate table usage.
Since it reads from information_schema.tables, we initially assumed it only accessed metadata. That assumption turned out to be wrong soon.
The hidden cost of information schema
When MariaDB retrieves data_length and index_length, it does not simply read metadata. Instead, it opens each table ibd file and reads a few pages from the tablespace header / index metadata areas least (~4 pages = ~64 KB).
A typical Frappe + ERPNext database contains around 700 tables, which means a single query can trigger roughly:
700 tables × ~4 I/O operations ≈ 2800 IOPS
The problem is not the amount of data, but the number of I/O operations. These reads happen in parallel across multiple threads.
At the same time, the server may already be handling user queries, background jobs, and backups. Together, this can easily exhaust disk I/O capacity and lead to a database stall.
Why the spike happens suddenly
If the query runs regularly, why do spikes happen only occasionally?
The answer lies in MariaDB’s internal caching. information_schema.tables maintains cached table statistics, so queries usually return quickly.
However, the cache can be invalidated when:
- The server restarts
- Roughly 20% of table data changes
- Certain internal thresholds are reached
When this happens, MariaDB must read table files again. If usage metrics are requested at that moment, the resulting reads can trigger a sudden I/O spike.
We later found similar reports in the MySQL bug tracker (#19588), confirming this behavior has existed for years. It becomes more noticeable on shared servers with many small tables, which matches our workload.
First attempt: tuning the database parameters
The root cause was excessive I/O, so we started by tuning database parameters to bring it under control.
MySQL and MariaDB both provide variables innodb_io_capacity and innodb_io_capacity_max (docs), which are meant to regulate background I/O activity. We set these to under 2500 IOPS (EBS gp3 default is 3000 IOPS), but this did not have any noticeable effect on queries against information_schema.tables.
Next, we increased the table_open_cache limit (docs) to keep more tables open and reduce repeated file reads. This helped slightly, but it also increased overall memory usage. More importantly, it did not solve the I/O spike issue caused by information_schema.tables.
Since this approach didn’t solve the problem, we explored an alternative way to calculate usage without relying on information_schema.tables.
Second attempt: file size-based reporting
Our first mitigation was to calculate usage using the stat system call to read file sizes directly. This approach is lightweight since it only reads metadata.
However, it introduced another problem. On shared servers, we do not charge for vacuum space. When rows are deleted, InnoDB keeps freed space for reuse instead of releasing it. As a result, file size does not reflect actual usage.
After deploying this, users saw large discrepancies in reported storage. Even after adjustments, inconsistencies remained, so we reverted the change.
However, the experiment revealed something important: for about 1.5 weeks, we did not see a single I/O spike or database freeze. This confirmed that information_schema.tables was a major contributor.
Third attempt: building a safer alternative
We still needed accurate usage metrics without triggering heavy I/O.
To solve this, we built a custom InnoDB parser based on MariaDB's source code. The innodb_ruby project and Jeremy Cole’s blog were especially helpful.
The tool reads only the required metadata directly from InnoDB files, with safeguards:
- Controlled concurrency for reading table files
- I/O budgeting, limiting the tool to at most 20% of disk IOPS
- Adaptive throttling, pausing if the server experiences I/O pressure
Together, these ensure it never overwhelms the server.
It also avoids another side effect of MariaDB. While calculating table usage internally, MariaDB may open new tables and close existing ones, which can impact performance on servers with thousands of sites. The custom tool simply opens a table file, reads the required pages, and closes it immediately to keep the live workload unaffected.
We published the library on PyPI. If you want to explore more, check the source code
Final rollout
After the full rollout, we received a few reports of mismatches between Frappe Cloud usage and the framework’s DB Analyzer. After investigation, the parser was accurate, but information_schema had stale data. MariaDB updates table size based on internal thresholds, so it is not always up to date.
We added a “Refresh DB usage” option in the site dashboard and DB Analyzer to clear the cache and sync values.
This has been deployed for the past month, and the spike-and-freeze incidents have effectively stopped. The most interesting part wasn’t the fix itself, but how long the issue stayed hidden. It took kernel-level I/O tracing to uncover a harmless-looking query masked by a monitoring blind spot.

